|
GBP/USD Technical Analysis: new lows for 2018 as traders await UK GDP on Friday
- A catatonic Sterling slumps to a new 12-month low, bears seeking out 2017 lows as Brexit and a dovish BoE continue to weigh on the GBP.
- A thin calendar for Thursday sees Pound traders awaiting Friday's UK GDP figures.
- The GBP/USD is on pace to close in the red for a fifth straight week.
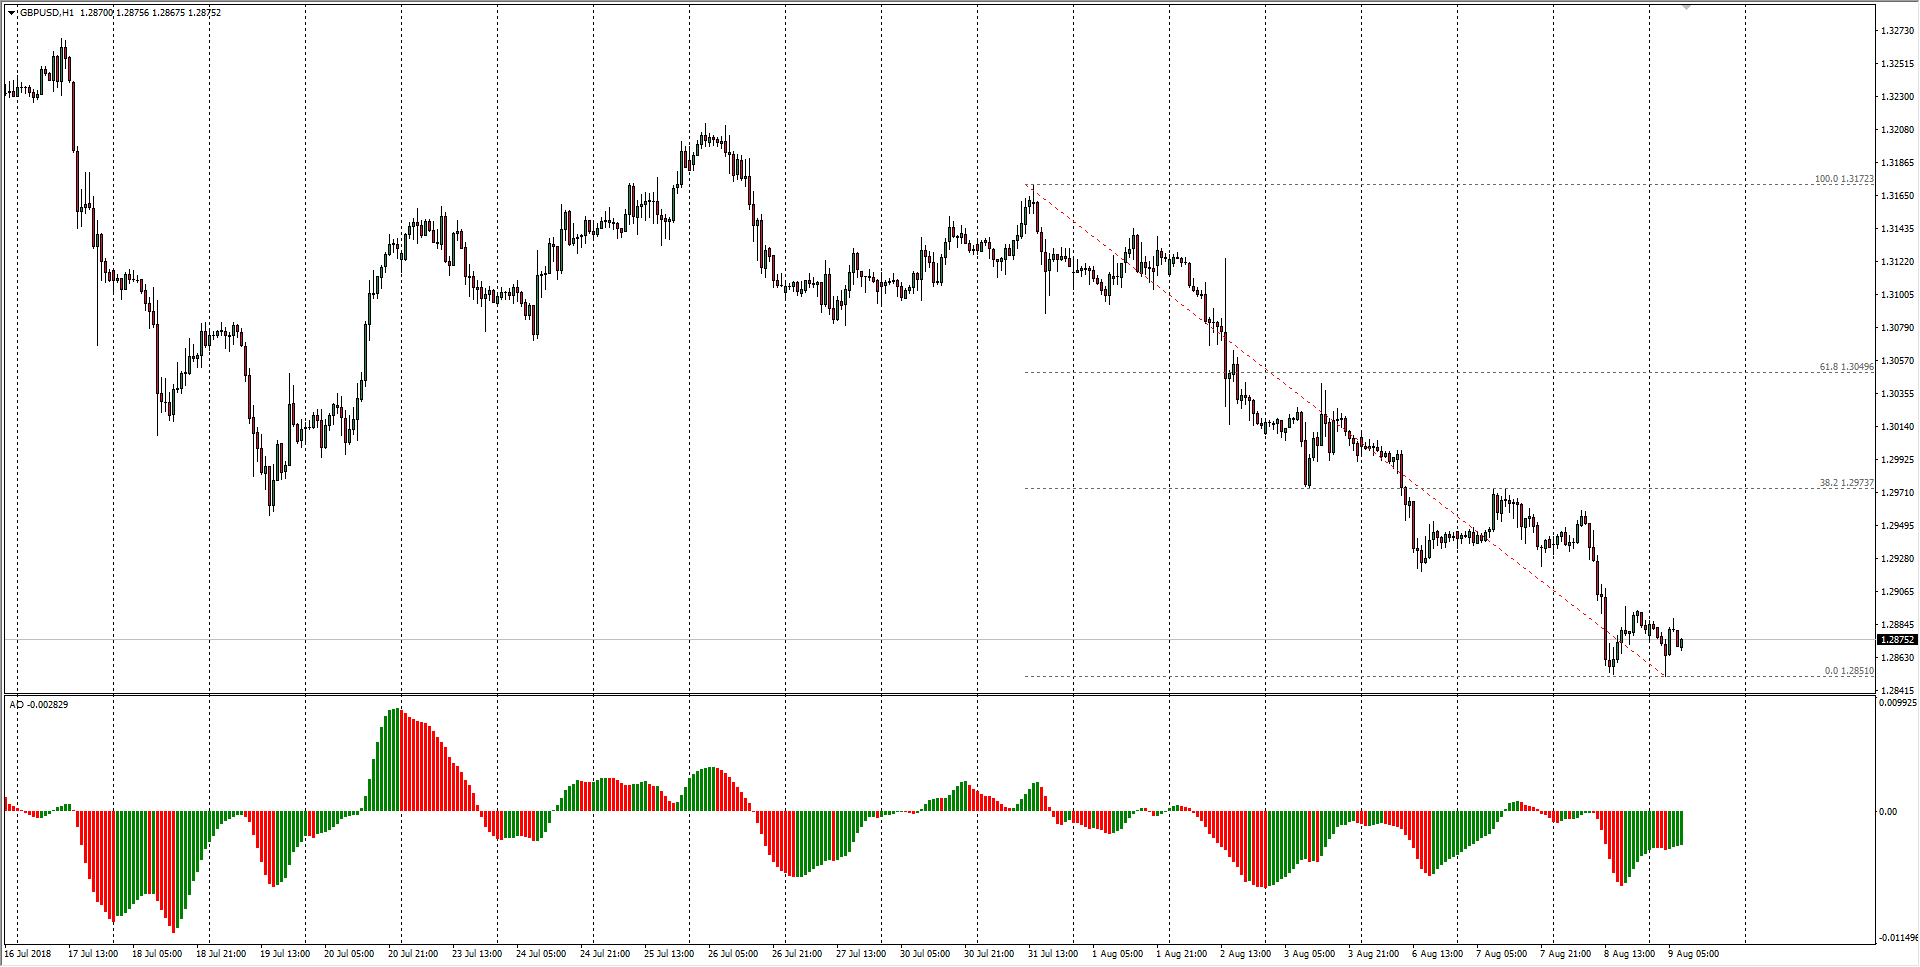
| Spot rate: | 1.2875 |
| Relative change: | Negligible |
| High: | 1.2888 |
| Low: | 1.2851 |
| Trend: | Bearish |
| Support 1: | 1.2851 (major technical bottom; 12-month low) |
| Support 2: | 1.2791 (S2 daily pivot) |
| Support 3: | 1.2773 (August 2017 swing low) |
| Resistance 1: | 1.2973 (38.2% Fibo retracement level) |
| Resistance 2: | 1.3010 (current week high) |
| Resistance 3: | 1.3172 (previous week high) |
Author

Joshua Gibson
FXStreet
Joshua joins the FXStreet team as an Economics and Finance double major from Vancouver Island University with twelve years' experience as an independent trader focusing on technical analysis.
More from Joshua Gibson


