GBP/USD Technical Analysis: Near-term bullish correction capped near 1.2600
- The Sterling is already drifting back into intraday support from the 38.2% Fibo level just shy of 1.2600 as GBP/USD eases away from Wednesday's peak reached in a run-up from 1.2477.
GBP/USD, 5-Minute
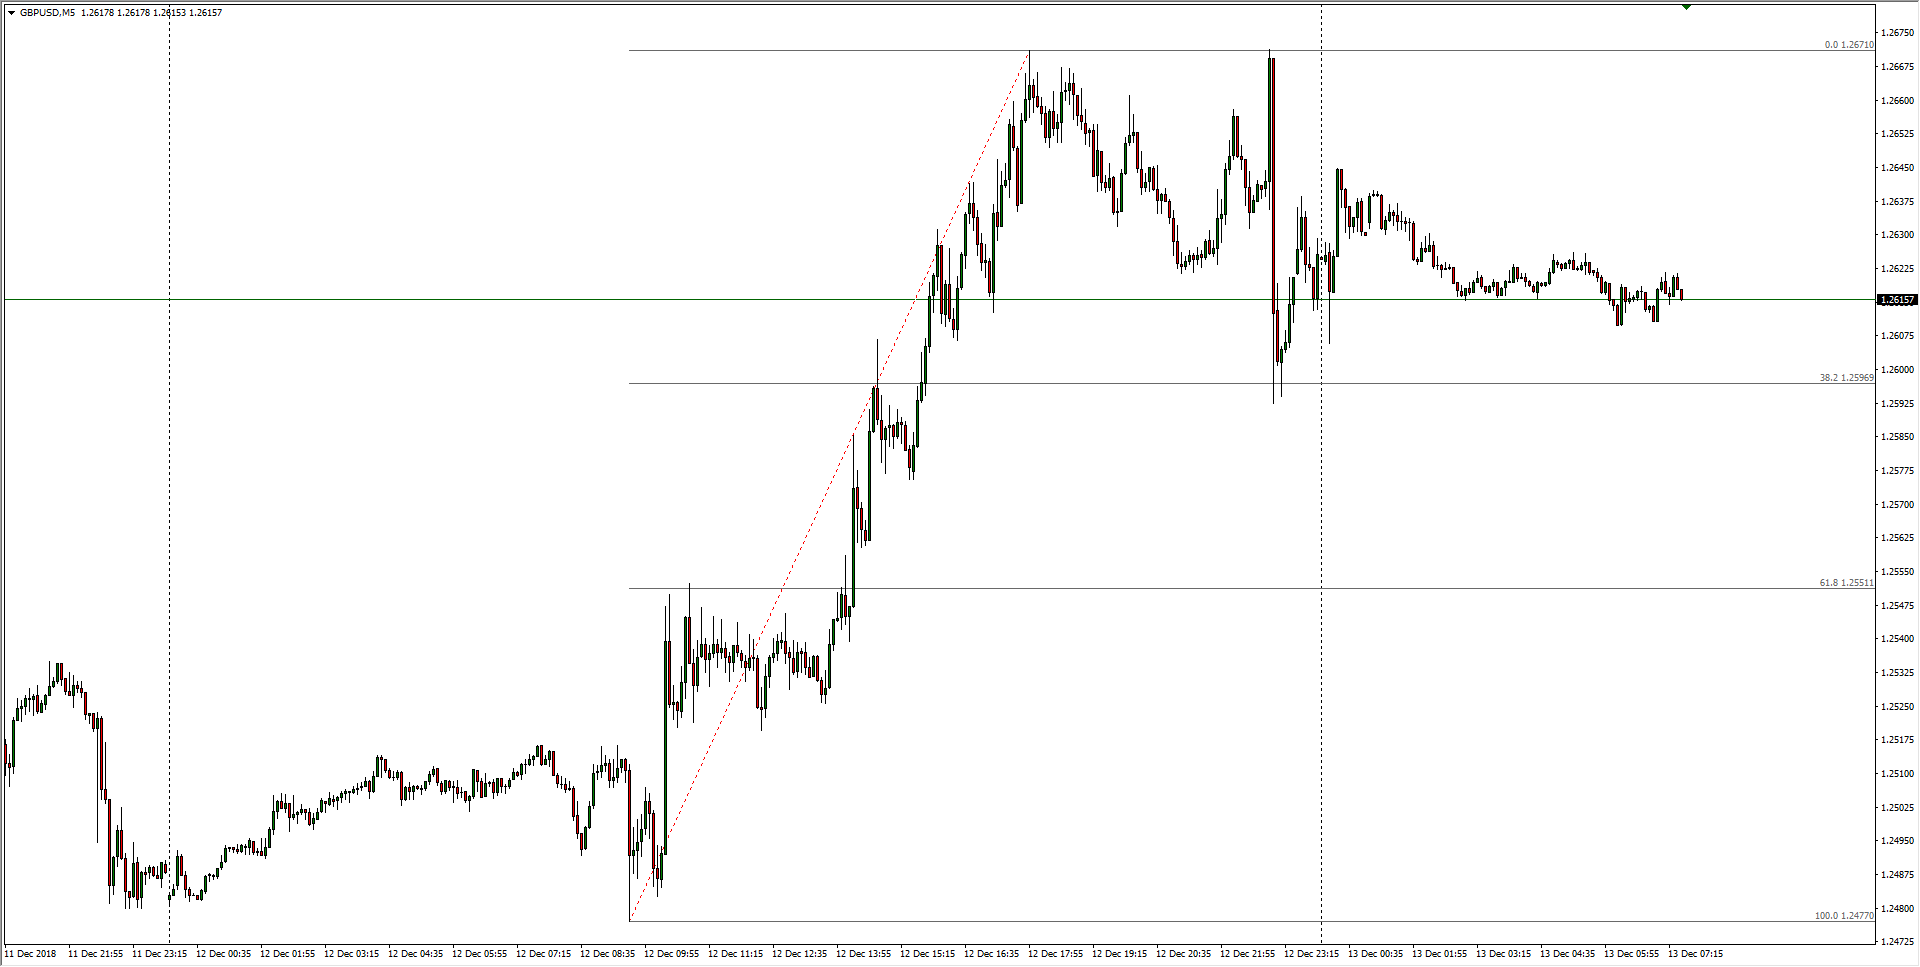
- In the near-term, the Cable could be geared for another step lower after failing to recover beyond the 61.8% Fibo retracement of the last swing high at 1.2685.
GBP/USD, 30-Minute
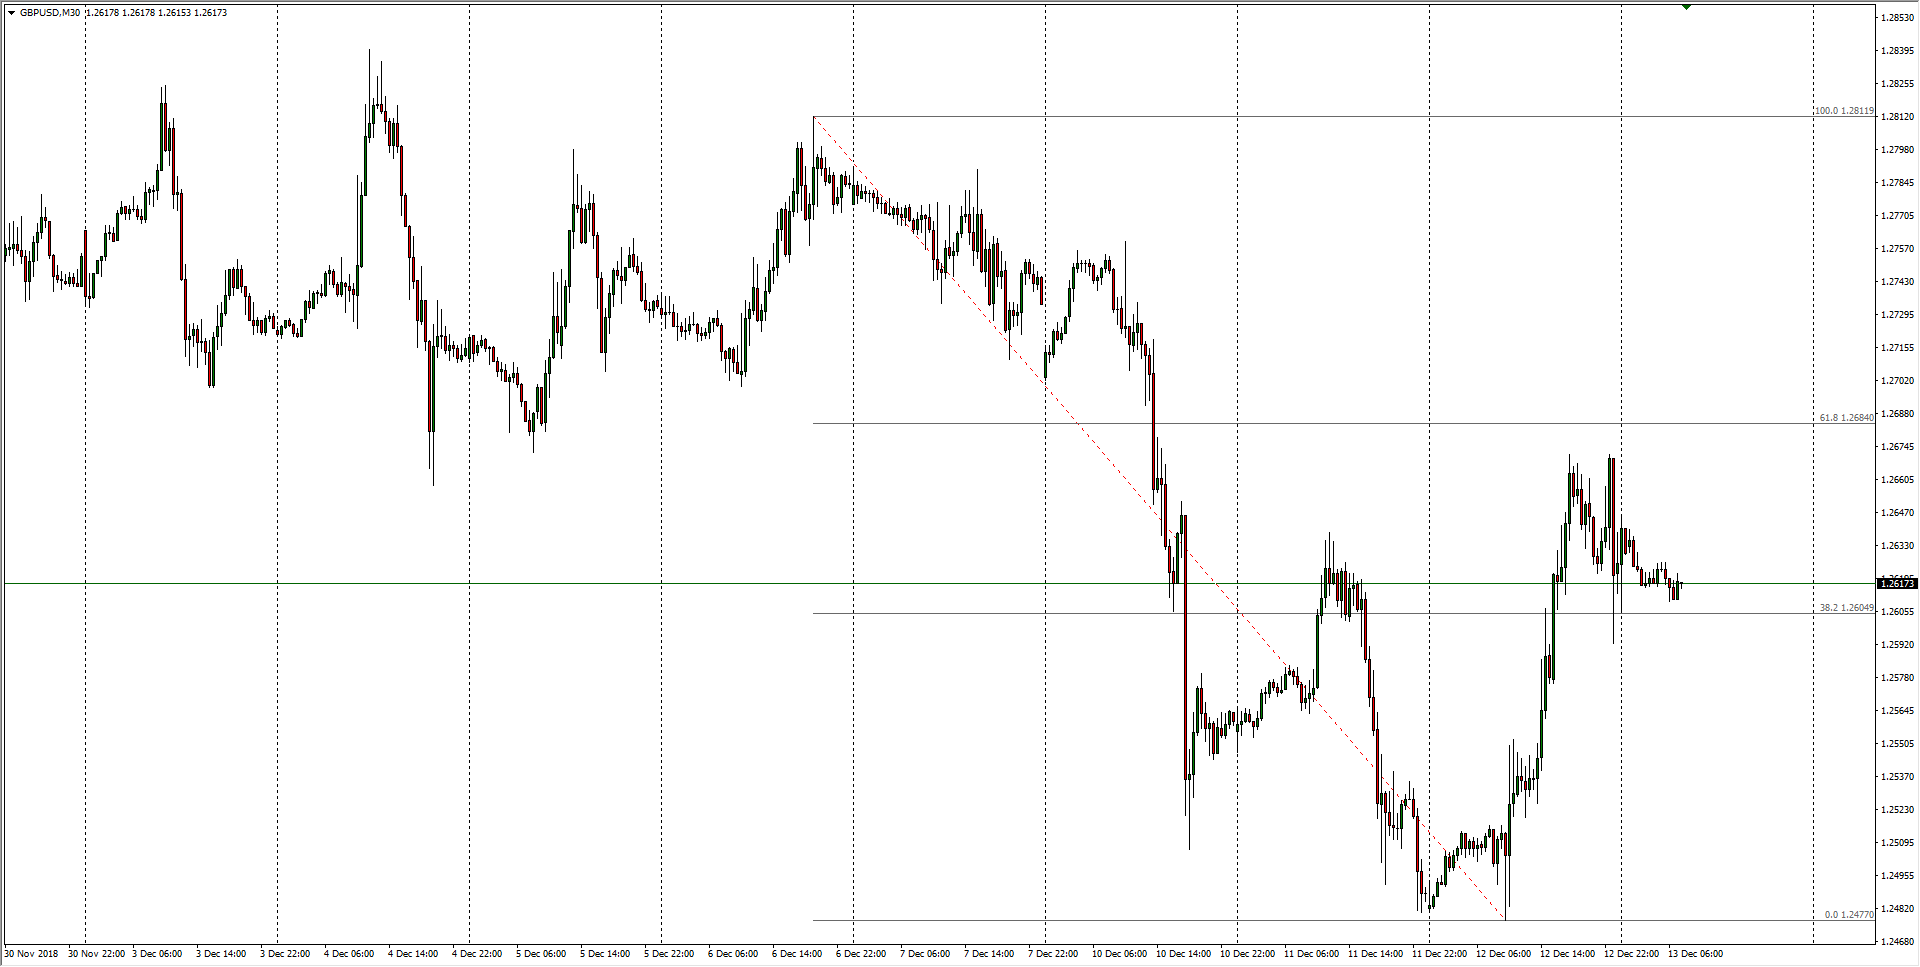
- A significant line in the sand has been drawn at the 1.2700 level, which could see any further bull moves rejected flat-out as the Cable grinds into a new sideways pattern.
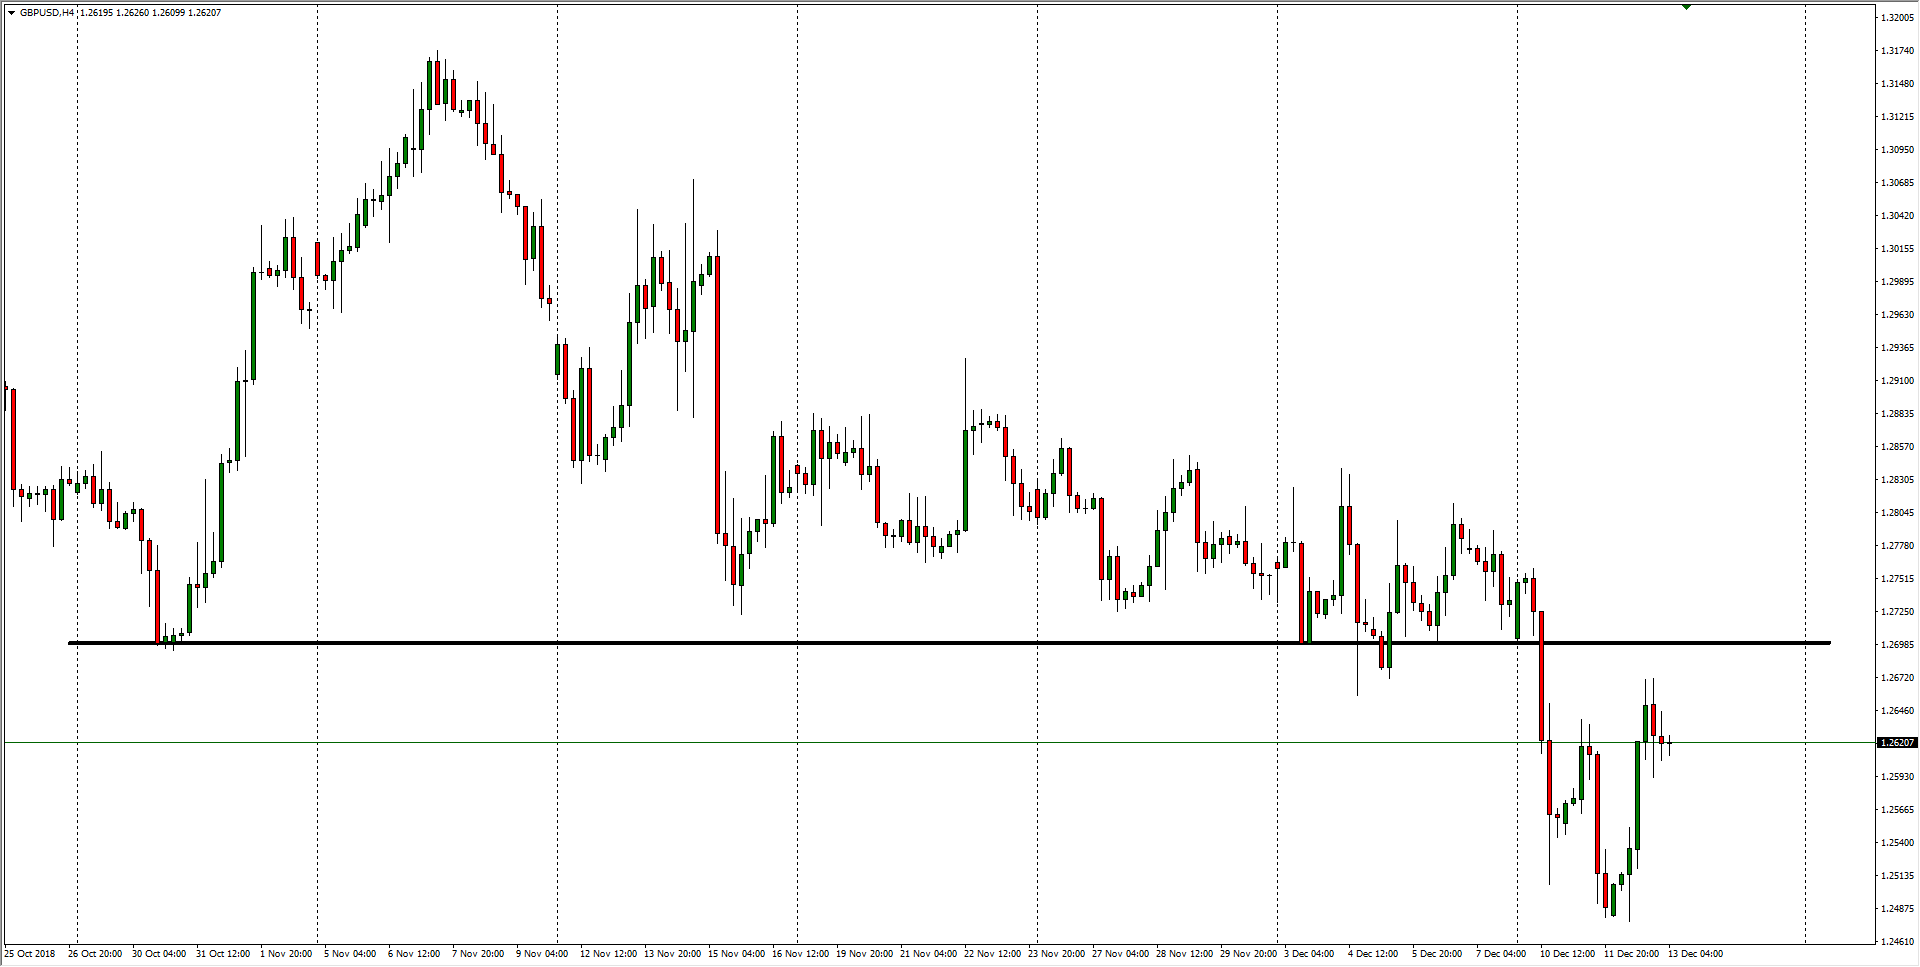
GBP/USD, 4-Hour
GBP/USD
Overview:
Today Last Price: 1.2617
Today Daily change: -54 pips
Today Daily change %: -0.426%
Today Daily Open: 1.2671
Trends:
Previous Daily SMA20: 1.2752
Previous Daily SMA50: 1.2907
Previous Daily SMA100: 1.2941
Previous Daily SMA200: 1.3269
Levels:
Previous Daily High: 1.2672
Previous Daily Low: 1.2477
Previous Weekly High: 1.284
Previous Weekly Low: 1.2659
Previous Monthly High: 1.3176
Previous Monthly Low: 1.2723
Previous Daily Fibonacci 38.2%: 1.2598
Previous Daily Fibonacci 61.8%: 1.2551
Previous Daily Pivot Point S1: 1.2541
Previous Daily Pivot Point S2: 1.2411
Previous Daily Pivot Point S3: 1.2346
Previous Daily Pivot Point R1: 1.2736
Previous Daily Pivot Point R2: 1.2802
Previous Daily Pivot Point R3: 1.2932
Author

Joshua Gibson
FXStreet
Joshua joins the FXStreet team as an Economics and Finance double major from Vancouver Island University with twelve years' experience as an independent trader focusing on technical analysis.


