|
GBP/USD technical analysis: GBP is going down, going down …

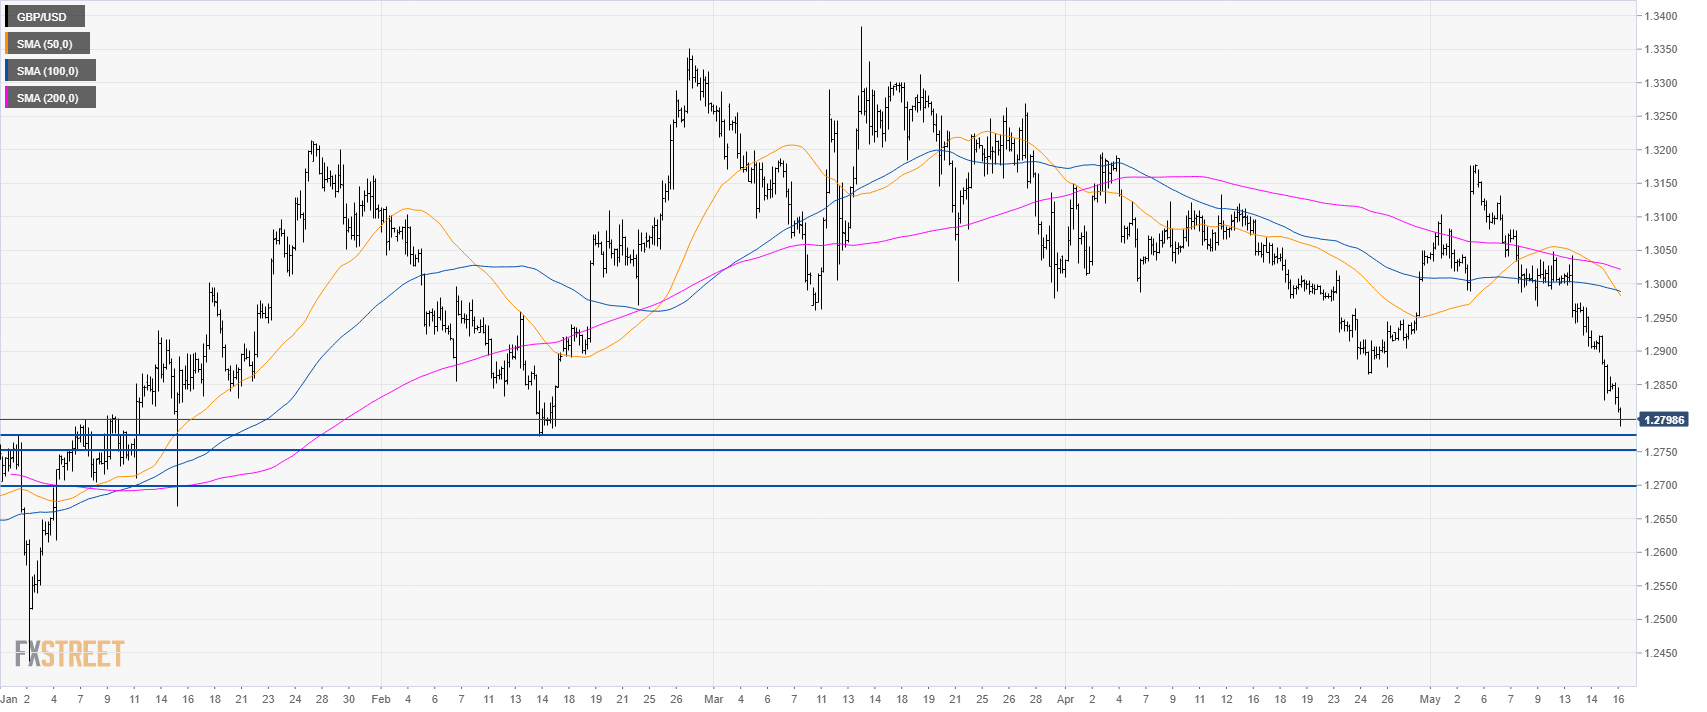
GBP/USD daily chart
GBP/USD is trading down in almost a vertical fashion below its main simple moving averages (SMAs). GBP/USD is nearing 1.2773, February low.

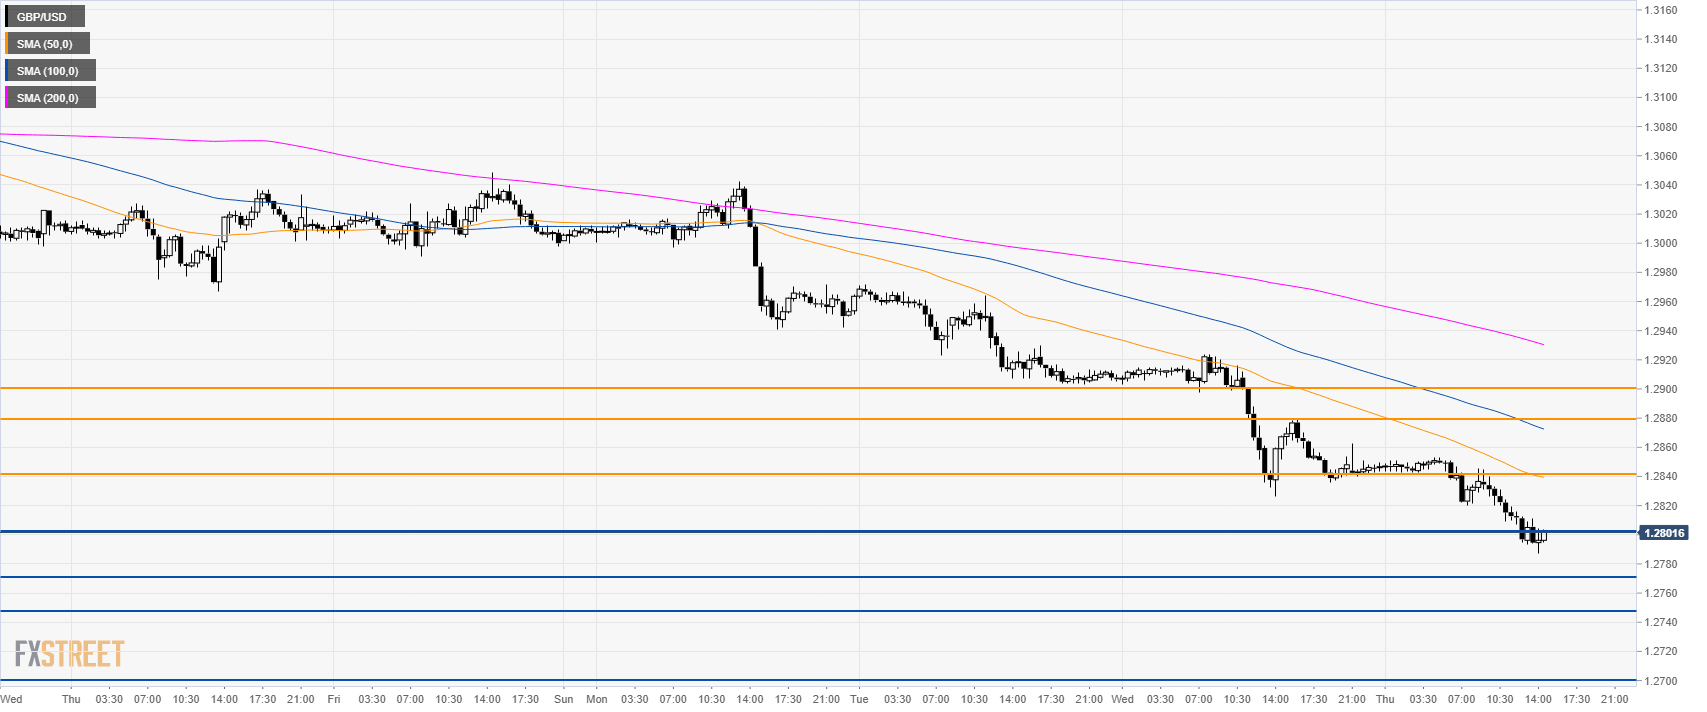
GBP/USD 4-hour chart
GBP/USD is challenging 1.2800 the figure opening the doors to further downside towards 1.2773, 1.2750 and 1.2700 figure.
Cable is trading below its main SMAs as the market is trading in a steep downtrend. Resistances are seen at 1.2840/80 and 1.2900 figure.
Additional key levels
Author

Flavio Tosti
Independent Analyst
More from Flavio Tosti


