|

GBP/USD Technical Analysis: Downside calling, trading sub-1.2900 figure

  • The cable is trading near its lowest point since the start of the week. 
  • The level to beat for sellers is the 1.2820 level.
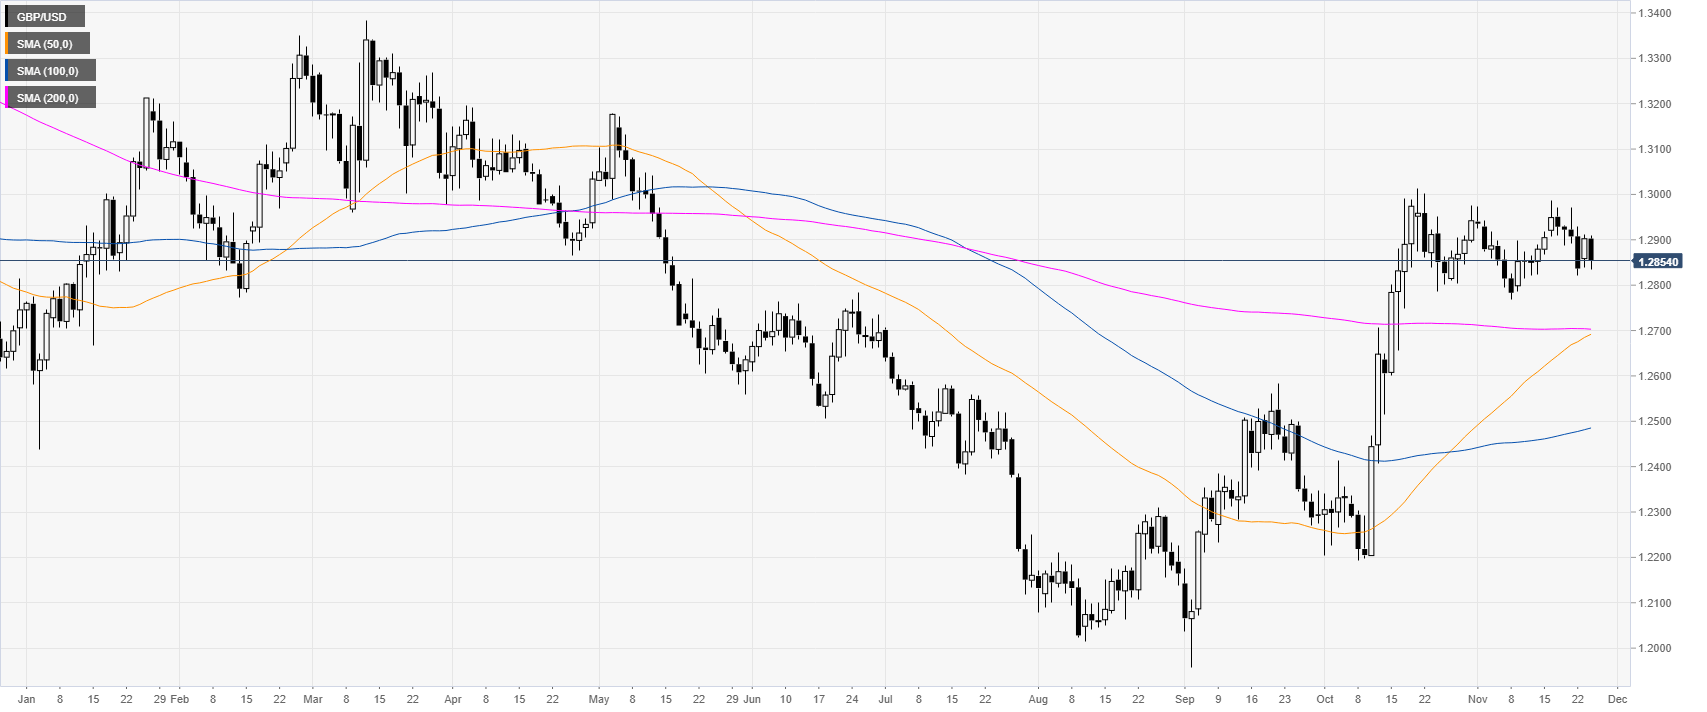
 

GBP/USD daily chart

 
GBP/USD is fighting for the 1.2900 handle as the market is consolidating in November. However, the spot keeps an underlying bullish momentum while trading above its main daily simple moving averages (DMAs).
 

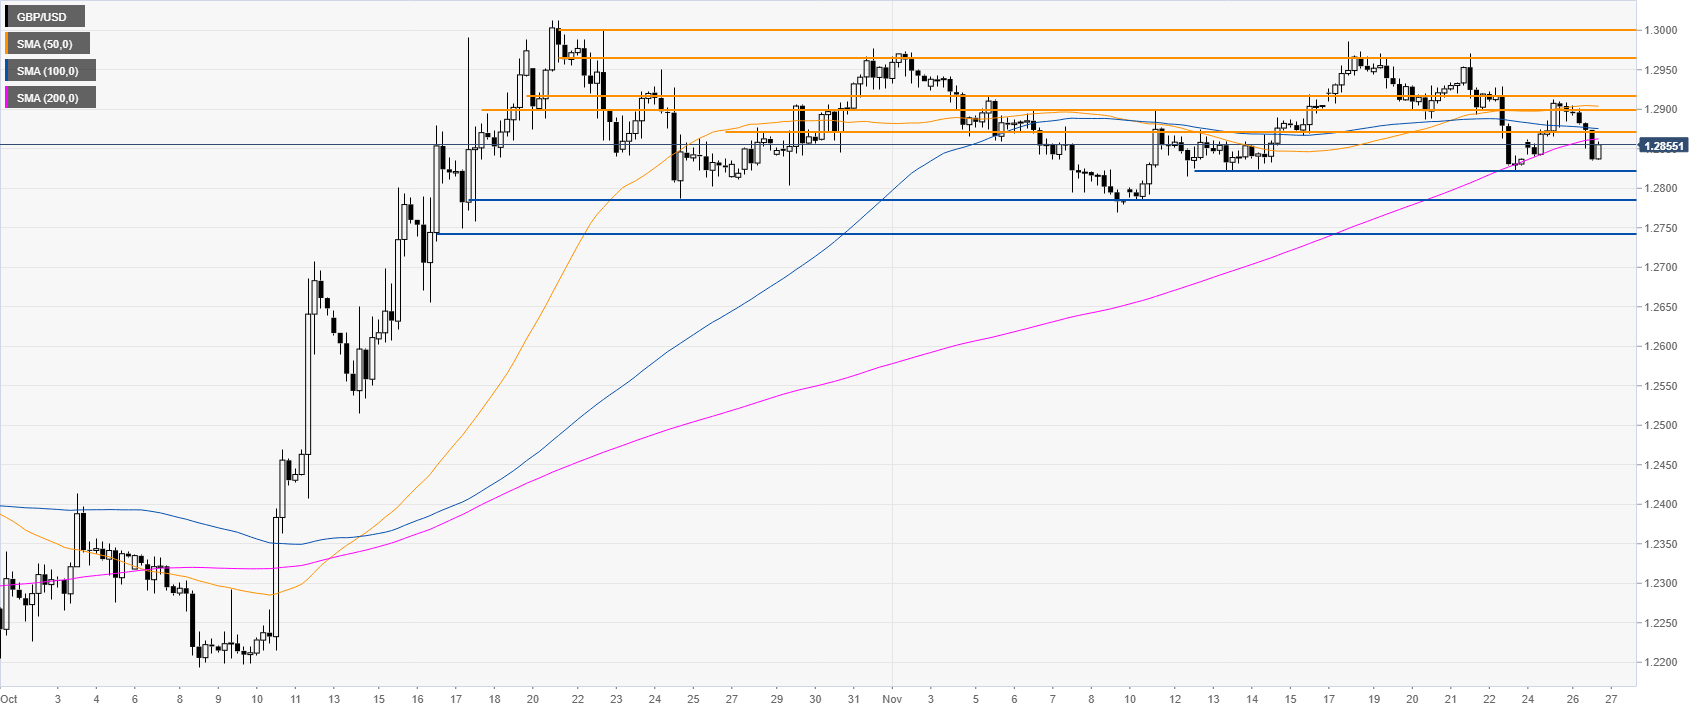
GBP/USD four-hour chart

 
The spot is trading below the 1.2900 figure and its main SMAs, suggesting a bearish bias in the medium term. A break below 1.2820 should trigger further weakness towards the 1.2785 and 1.2742 price levels, according to the Technical Confluences Indicator
 

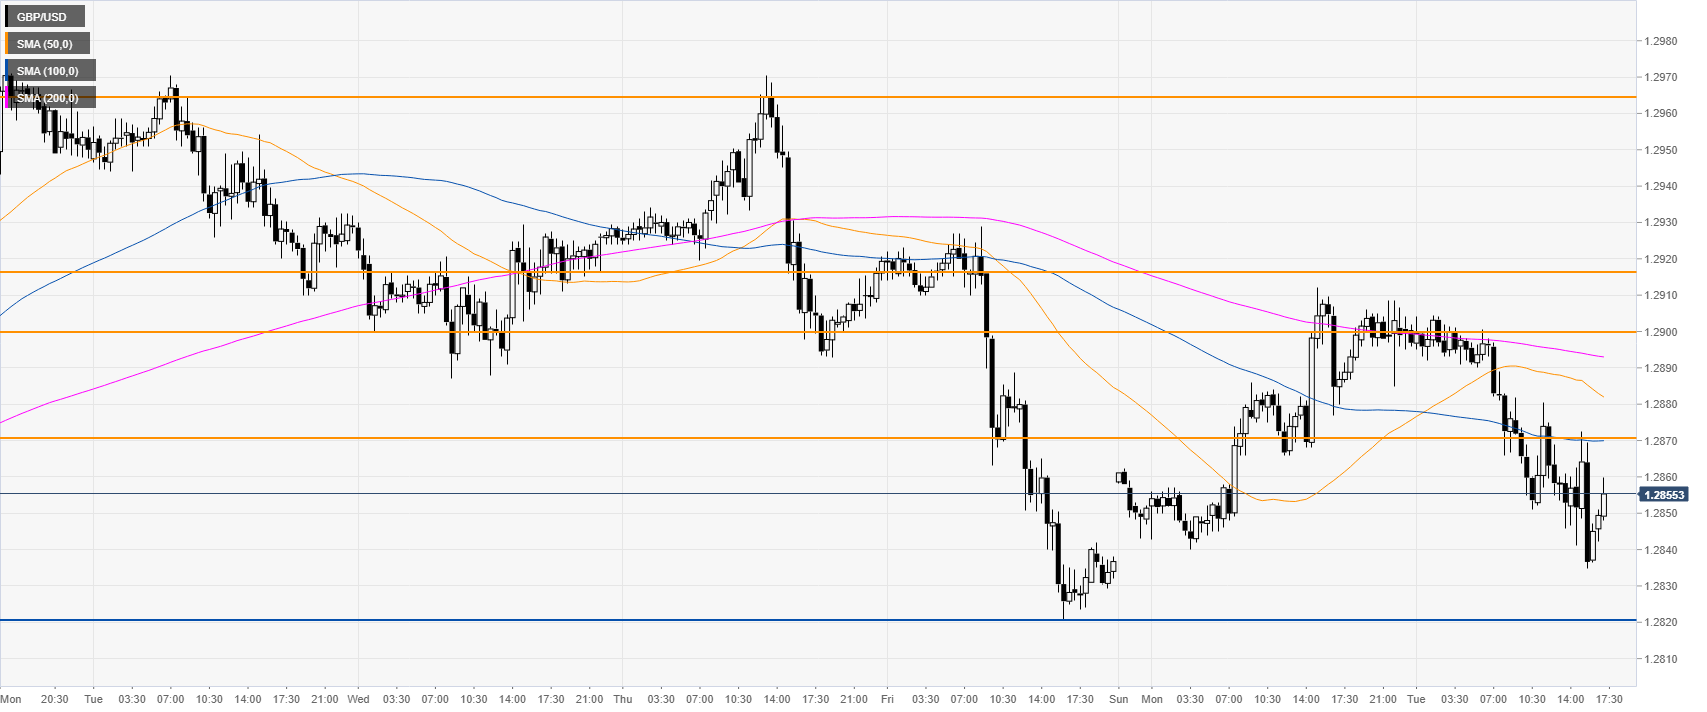
GBP/USD 30-minute chart

 
Sterling is trading below its main SMAs, suggesting a bearish bias in the short term. Resistance is expected at 1.2870 and the 1.2900/1.2910 price zone, according to the Technical Confluences Indicator.  
 

Additional key levels

GBP/USD

Overview
Today last price1.2852
Today Daily Change-0.0050
Today Daily Change %-0.39
Today daily open1.2902
 
Trends
Daily SMA201.2883
Daily SMA501.2685
Daily SMA1001.2481
Daily SMA2001.2704
 
Levels
Previous Daily High1.2912
Previous Daily Low1.284
Previous Weekly High1.2986
Previous Weekly Low1.2821
Previous Monthly High1.3013
Previous Monthly Low1.2194
Daily Fibonacci 38.2%1.2885
Daily Fibonacci 61.8%1.2868
Daily Pivot Point S11.2858
Daily Pivot Point S21.2813
Daily Pivot Point S31.2785
Daily Pivot Point R11.293
Daily Pivot Point R21.2957
Daily Pivot Point R31.3002

Author

Flavio Tosti

Flavio Tosti

Independent Analyst


More from Flavio Tosti
Share:

Editor's Picks

EUR/USD holds firm above 1.1900 as US NFP looms

EUR/USD holds its upbeat momentum above 1.1900 in the European trading hours on Wednesday, helped by a broadly weaker US Dollar. Markets could turn cautious later in the day as the delayed US employment report for January will takes center stage. 

GBP/USD remains above nine-day EMA near 1.3650

GBP/USD recovers its recent losses from the previous session, trading around 1.3680 during the European hours on Wednesday. The technical analysis of the daily chart indicates a sustained bullish bias, as the pair trades within an ascending channel pattern.

Gold sticks to gains near $5,050 as focus shifts to US NFP

Gold holds moderate gains near the $5,050 level in the European session on Wednesday, reversing a part of the previous day's modest losses amid dovish US Federal Reserve-inspired US Dollar weakness. This, in turn, is seen as a key factor acting as a tailwind for the non-yielding yellow metal ahead of the critical US NFP release. 

US Nonfarm Payrolls expected to show modest job gains in January

The United States Bureau of Labor Statistics will release the delayed Nonfarm Payrolls data for January on Wednesday at 13:30 GMT. Investors expect NFP to rise by 70K following the 50K increase recorded in December.

S&P 500 at 7,000 is a valuation test, not a liquidity problem

The rebound from last week’s drawdown never quite shook the sense that it was being supported by borrowed conviction. The S&P 500 once again tested near the 7,000 level (6,986 as the high watermark) and failed, despite a macro backdrop that would normally be interpreted as supportive of risk.

Bitcoin price slips below $67,000 ahead of US Nonfarm Payrolls data

Bitcoin price extends losses, and trades below the lower consolidating boundary at $67,300 at the time of writing. A firm close below this level could trigger a deeper correction for BTC. Despite the weakness in price action, institutional demand shows signs of support, recording mild inflows in ETFs so far this week.