|

GBP/USD technical analysis: Cable under pressure below the 1.2100 handle

  • GBP/USD is weak below 1.2100 in the New York session
  • The levels to beat for bears are the 1.2065 and 1.2052 levels.
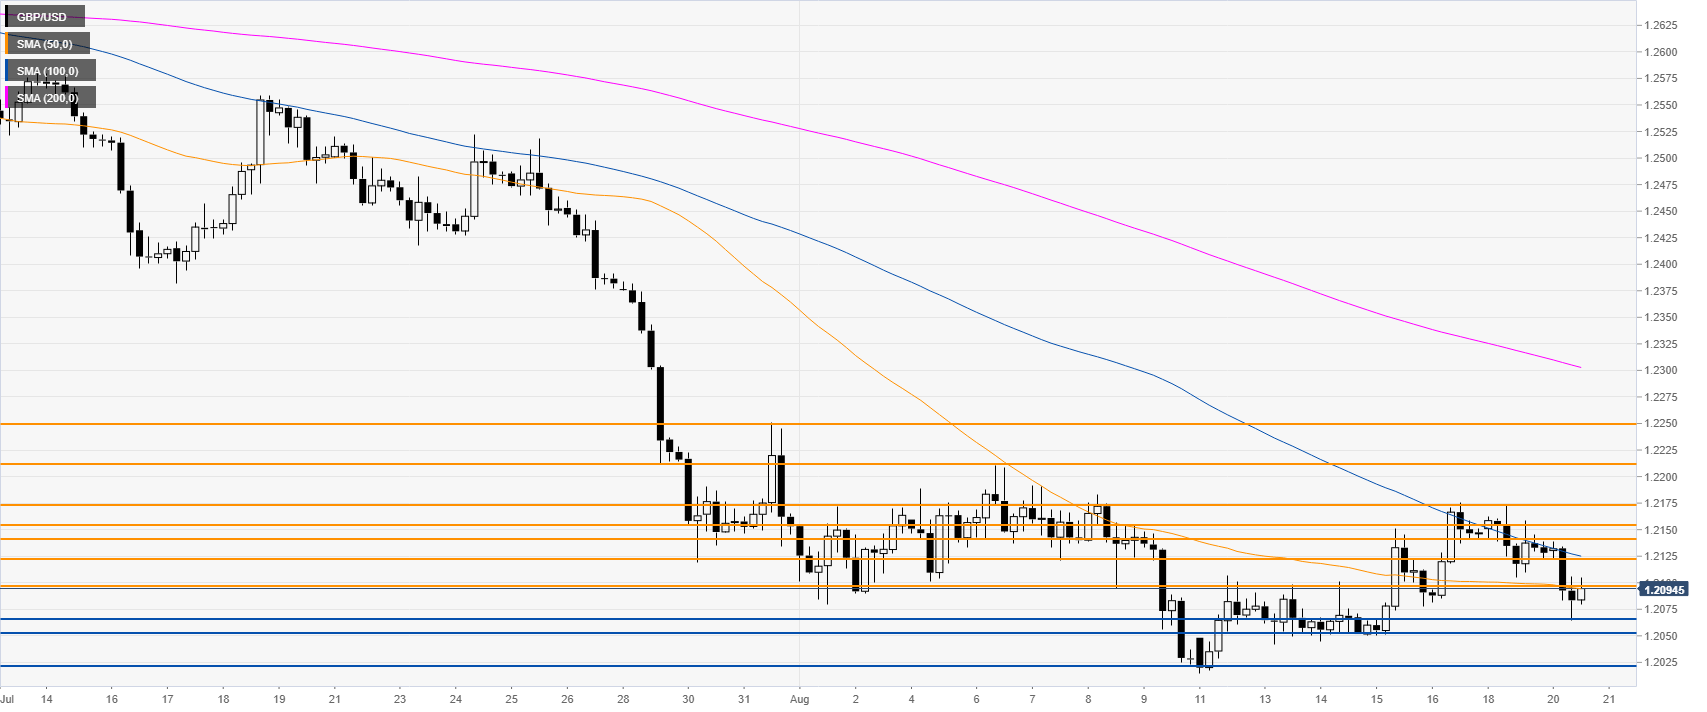
 

GBP/USD daily chart

 
The Cable is trading in a bear trend below the main daily simple moving averages (SMAs). 

GBP/USD 4-hour chart

 
GBP/USD is trading below 1.2097 resistance and the 100/200 SMAs suggesting a bearish bias in the medium term. The levels to beat for bears are 1.2065, followed by 1.2052, 1.2021 according to the Technical Confluences Indicator.
 

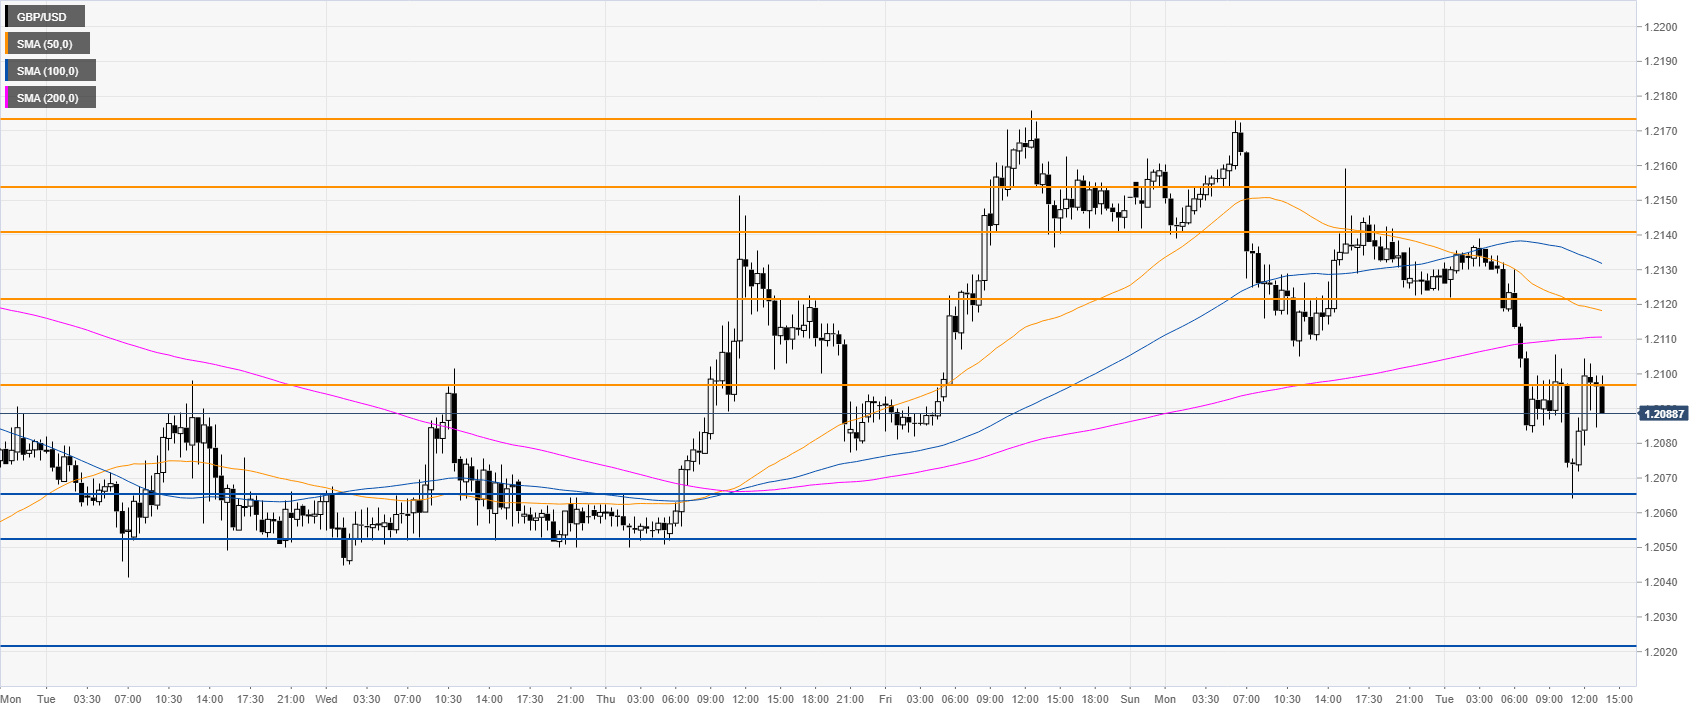
GBP/USD 30-minute chart

 
GBP/USD is losing steam on Tuesday. Immediate resistances are seen at 1.2097, 1.2122, 1.2141, 1.2154 and the 1.2173 level, according to the Technical Confluences Indicator.


Additional key levels

GBP/USD

Overview
Today last price1.2096
Today Daily Change-0.0031
Today Daily Change %-0.26
Today daily open1.2127
 
Trends
Daily SMA201.2188
Daily SMA501.243
Daily SMA1001.2665
Daily SMA2001.2794
Levels
Previous Daily High1.2173
Previous Daily Low1.2105
Previous Weekly High1.2176
Previous Weekly Low1.2015
Previous Monthly High1.2706
Previous Monthly Low1.2119
Daily Fibonacci 38.2%1.2131
Daily Fibonacci 61.8%1.2147
Daily Pivot Point S11.2097
Daily Pivot Point S21.2067
Daily Pivot Point S31.2029
Daily Pivot Point R11.2165
Daily Pivot Point R21.2203
Daily Pivot Point R31.2233

Author

Flavio Tosti

Flavio Tosti

Independent Analyst


More from Flavio Tosti
Share:

Editor's Picks

EUR/USD consolidates around 1.0900, bullish bias remains ahead of key US data

The EUR/USD pair is seen consolidating its strong gains registered over the past two days and oscillating in a narrow band during the Asian session on Tuesday. Spot prices currently trade around the 1.1900 mark, just below an over one-week high touched the previous day.

GBP/USD tilts bullish as markets barrel toward mid-week NFP print

GBP/USD is holding a broader bullish structure on the daily chart, with price trading well above the 50 Exponential Moving Average at 1.3507 and the 200 EMA at 1.3310, confirming the intermediate uptrend that has been in place since the November 2025 low near 1.2300. 

Gold falls below $5,050 as traders await US jobs data

Gold price attracts some sellers near $5,035 during the early Asian session on Tuesday. The precious metal edges lower amid improved risk sentiment and some profit-taking. Traders brace for key US economic data later this week, including delayed employment and inflation reports. 

Litecoin eyes $50 as heavy losses weigh on investors

Following a strong downtrend across the crypto market over the past week, Litecoin holders are under immense pressure. The Bitcoin fork has trimmed about $1.81 billion from its market capitalization since the beginning of the year, sending it below the top 20 cryptos by market cap.

The market is buying everything again but is it dancing on a borrowed floor

The market has a short memory and a fast trigger finger. Last week’s liquidation barely cooled before risk came roaring back, pushing the S&P toward record territory and reinstalling Big Tech as the engine of choice. This is not discovery. It is re exposure.

Ripple exposed to volatility amid low retail interest, modest fund inflows

Ripple (XRP) is extending its intraday decline to around $1.40 at the time of writing on Monday amid growing pressure from the retail market and risk-off sentiment that continues to keep investors on the sidelines.