|
GBP/USD technical analysis: Cable tumbles below 1.2100 handle as Brexit chaos weighs on Sterling
- The Cable is starting the week on the defensive breaking below the 1.2100 handle.
- The levels to beat for sellers are seen at 1.2065, followed by 1.2035 support levels.
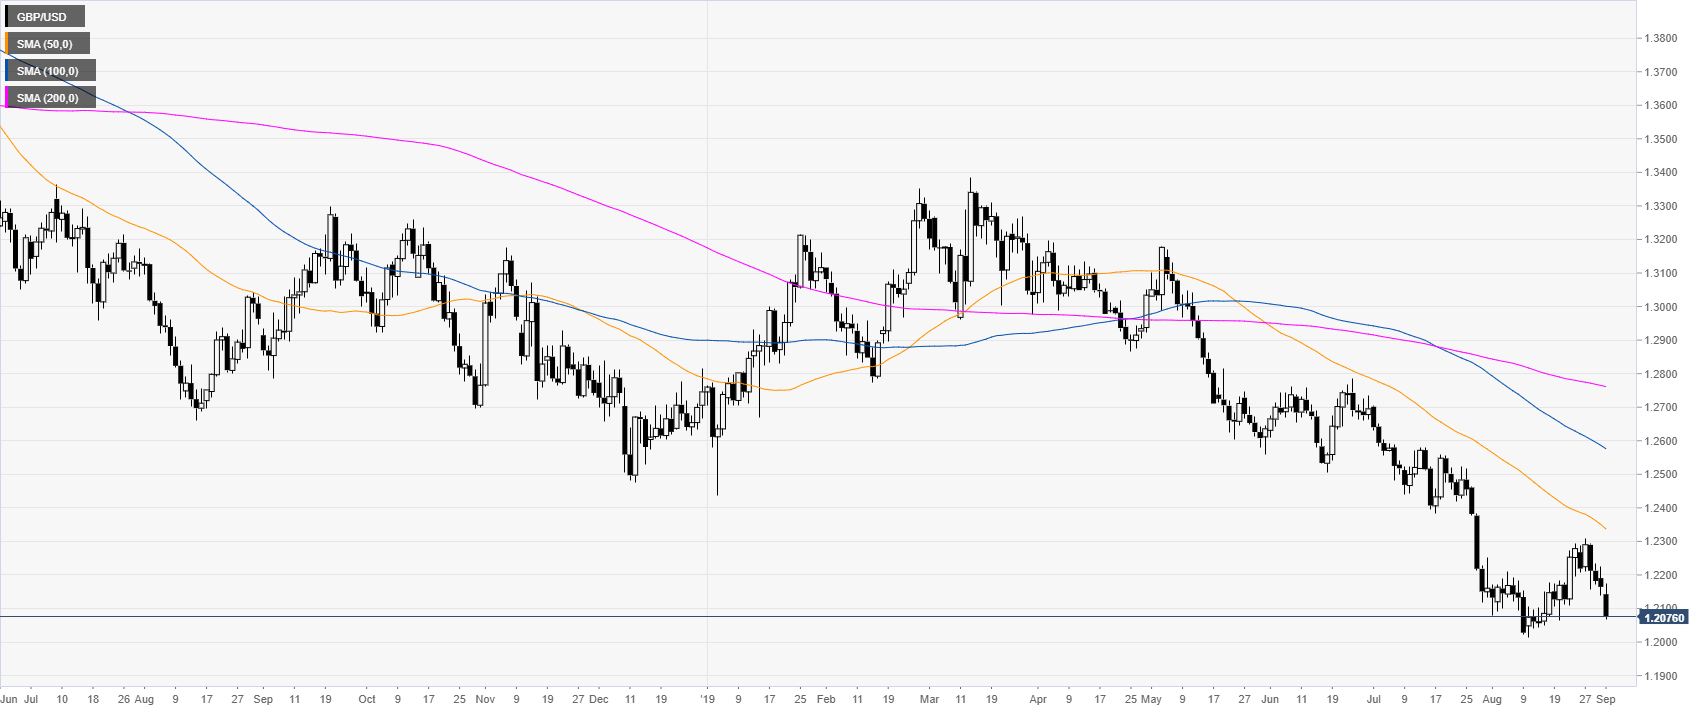
GBP/USD daily chart
The Great British Pound is trading in a bear trend below the main daily simple moving averages (SMAs). GBP/USD is starting the week on the defensive as the threat of elections in the UK is weighing on the Sterling.
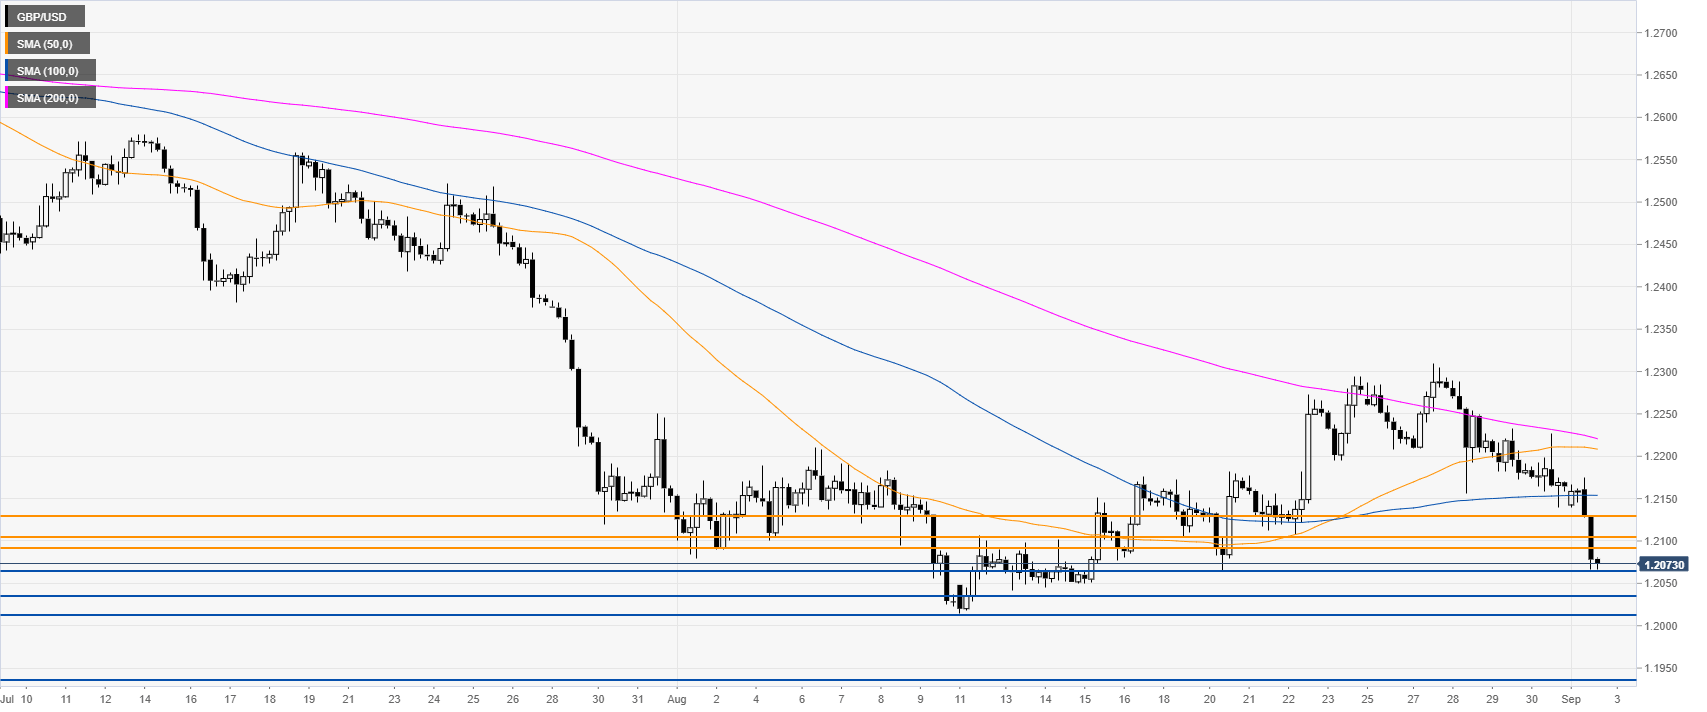
GBP/USD 4-hour chart
The Cable is trading below 1.2091/1.2104 resistance zone and the main SMAs on the 4-hour time frame. GBP/USD bears are most likely looking for a break below the 1.2065 support to potentially reach the 1.2035, 1.2010 and 1.1935 levels on the way down, according to the Technical Confluences Indicator.
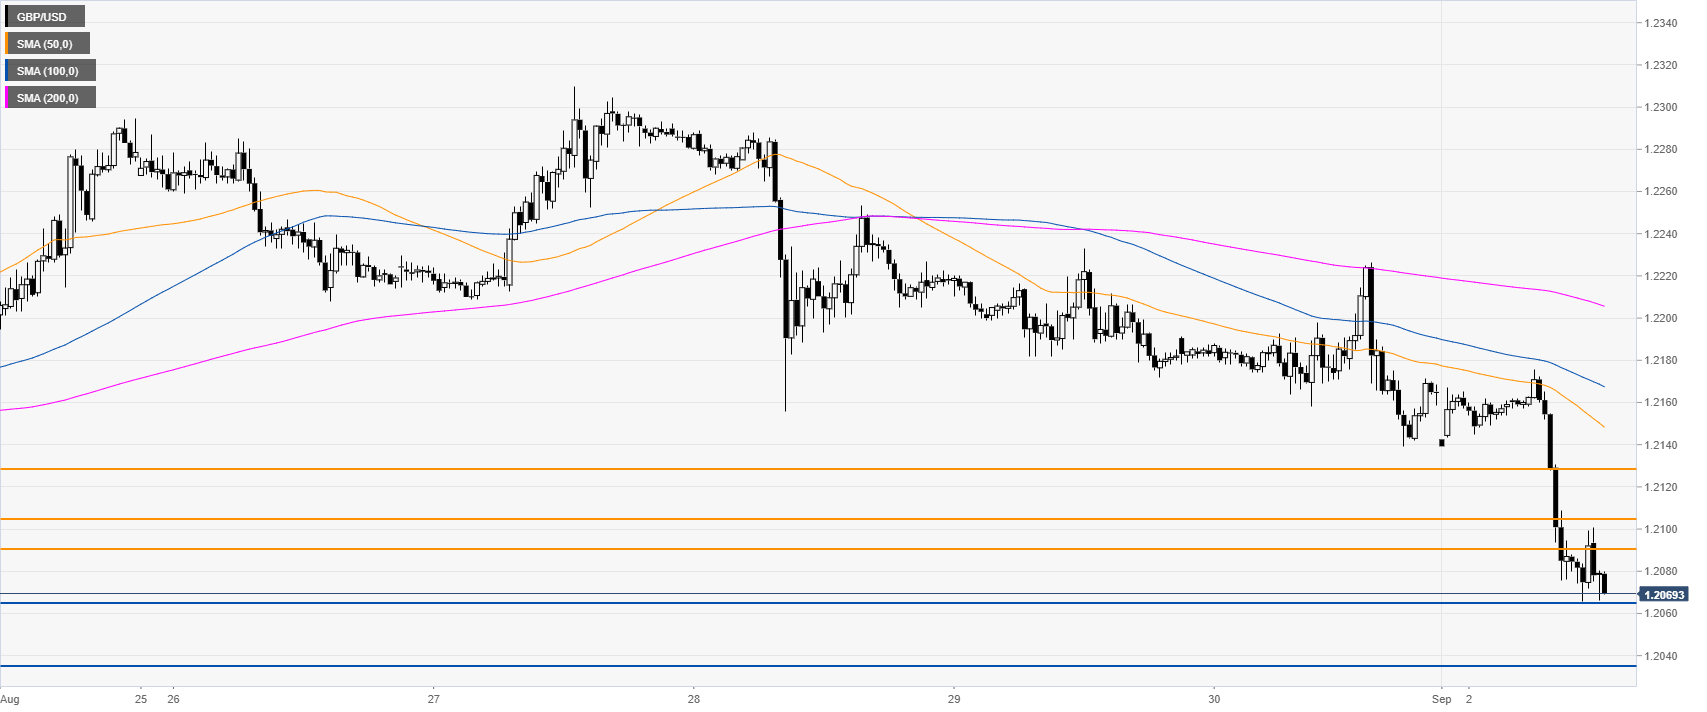
GBP/USD 30-minute chart
GBP/USD is trading below the main SMAs, suggesting a bearish bias in the near term. Immediate resistances are seen at the 1.2091/1.2104 levels followed by 1.2130, according to the Technical Confluences Indicator.
Additional key levels
Author

Flavio Tosti
Independent Analyst
More from Flavio Tosti


