|
GBP/USD technical analysis: Cable trades at daily highs challenging the 1.2440 resistance level
- GBP/USD takes a breather and bounces from the 1.2400 level.
- Resistances are seen at 1.2440 and 1.2480, according to the Technical Confluences Indicator.

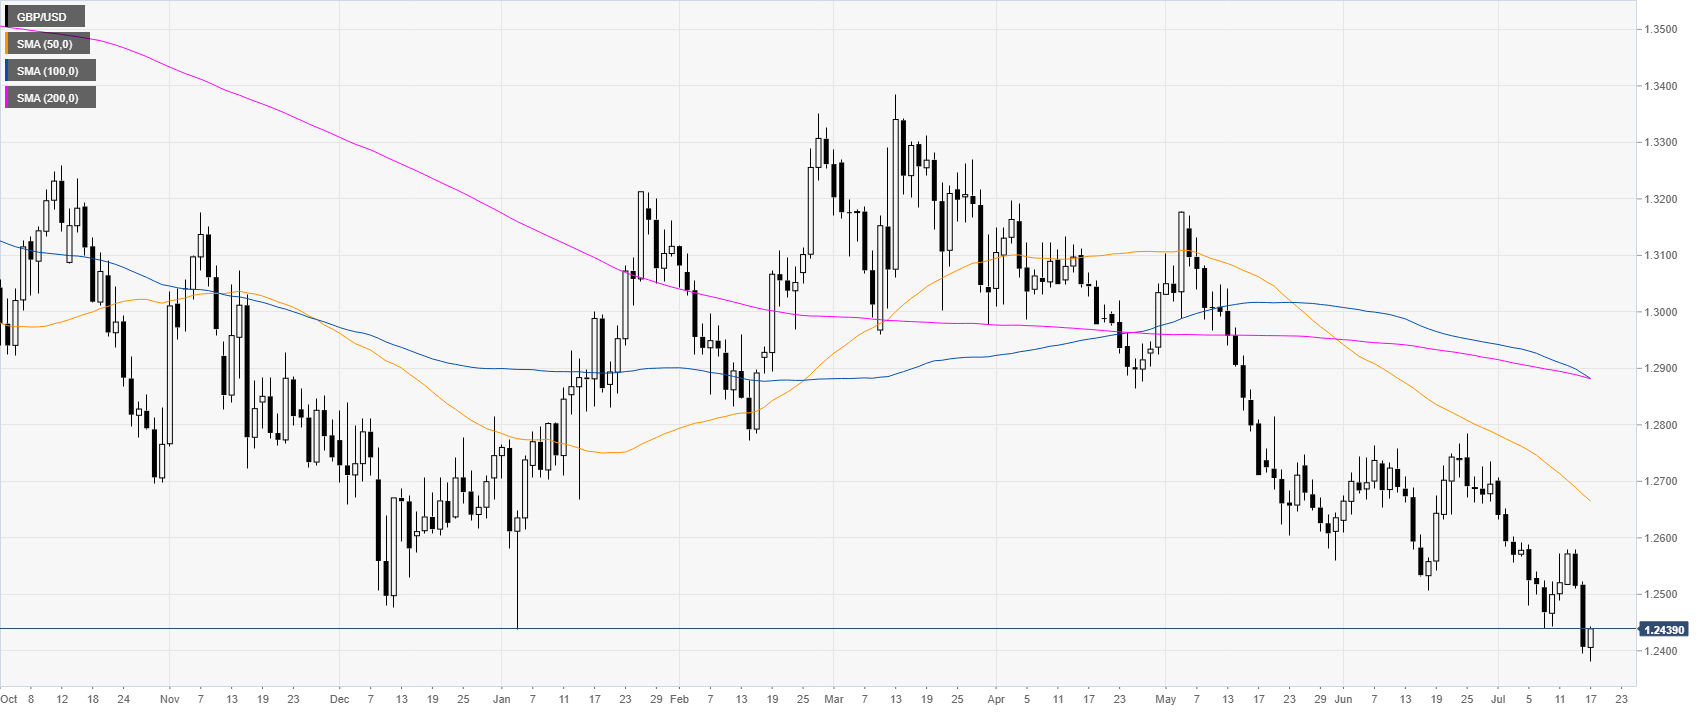
GBP/USD daily chart
GBP/USD is trading at 27-month lows as the market is having a small rebound above the 1.2400 figure.
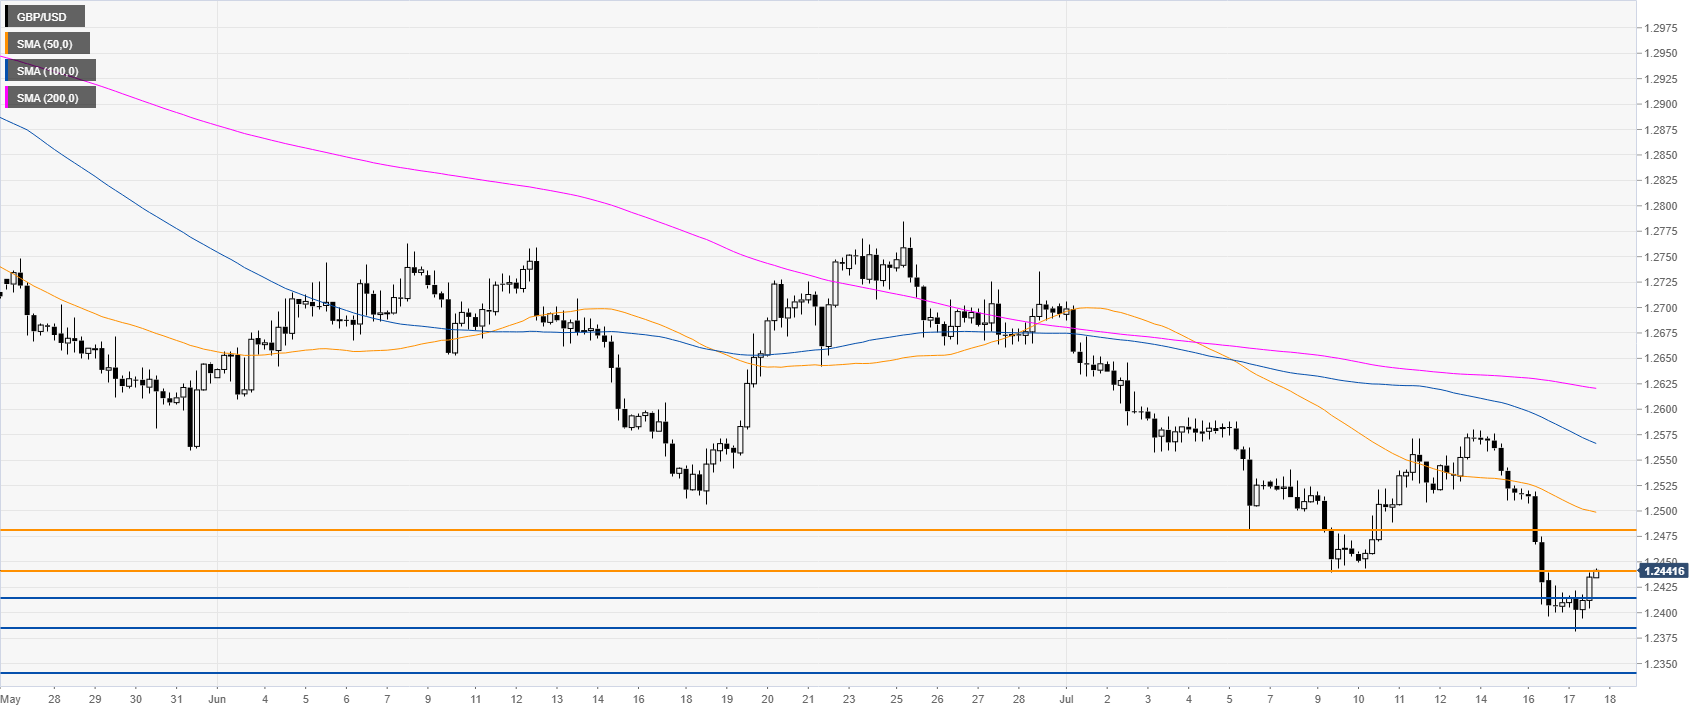
GBP/USD 4-hour chart
Cable is challenging the 1.2440 resistance area. If bulls manage to break above 1.2440 the next resistance can be seen at 1.2480, according to the Technical Confluences Indicator.
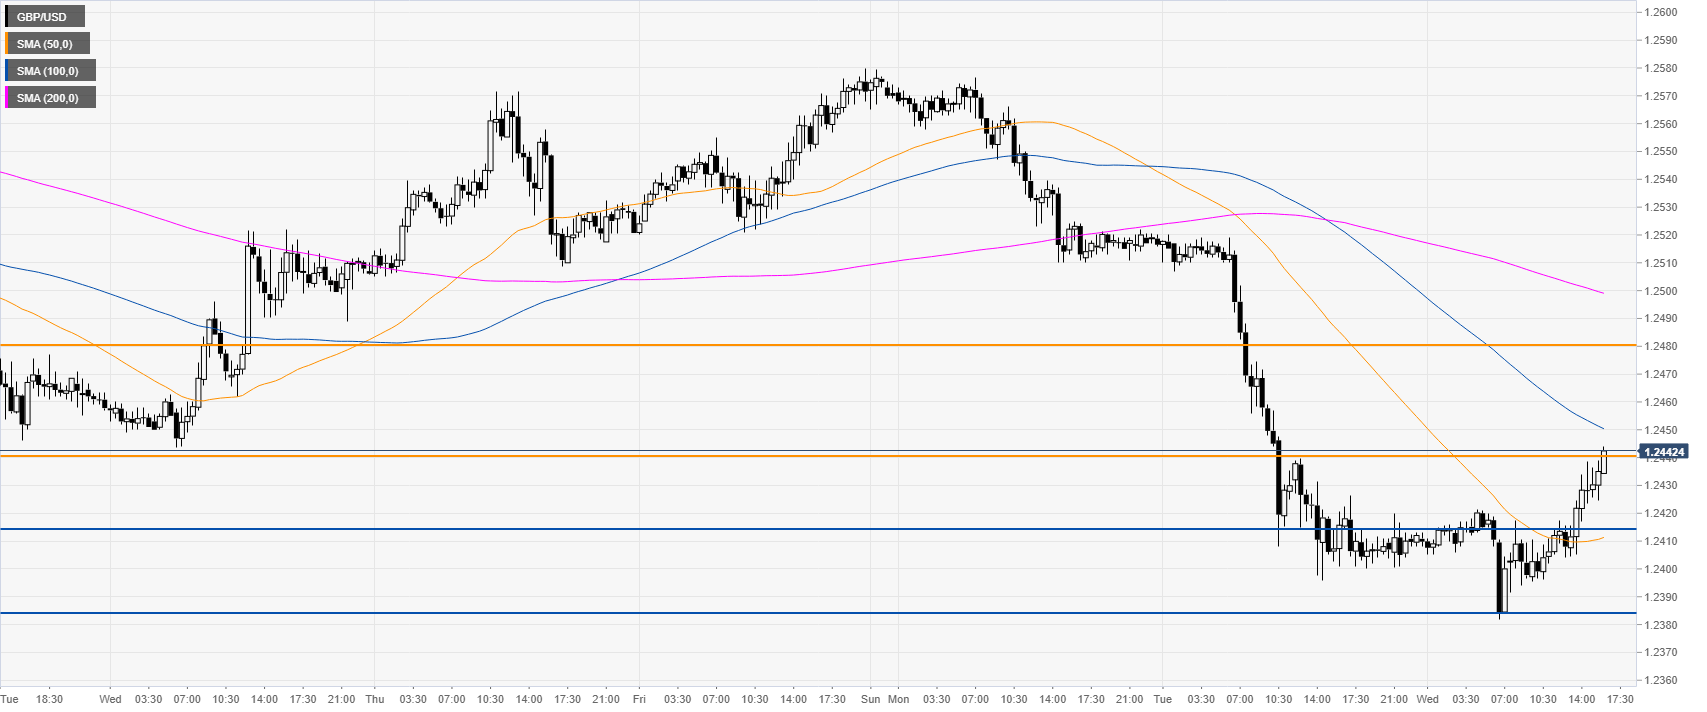
GBP/USD 30-minute chart
GBP/USD is trading between the 50 and 100 SMAs suggesting a correction in the medium term. Supports can be seen near 1.2414 and 1.2385.

Additional key levels
Author

Flavio Tosti
Independent Analyst
More from Flavio Tosti


