|

GBP/USD Technical Analysis: Cable sinks to its lowest level since June 2017 as bears attack the 1.2600 figure
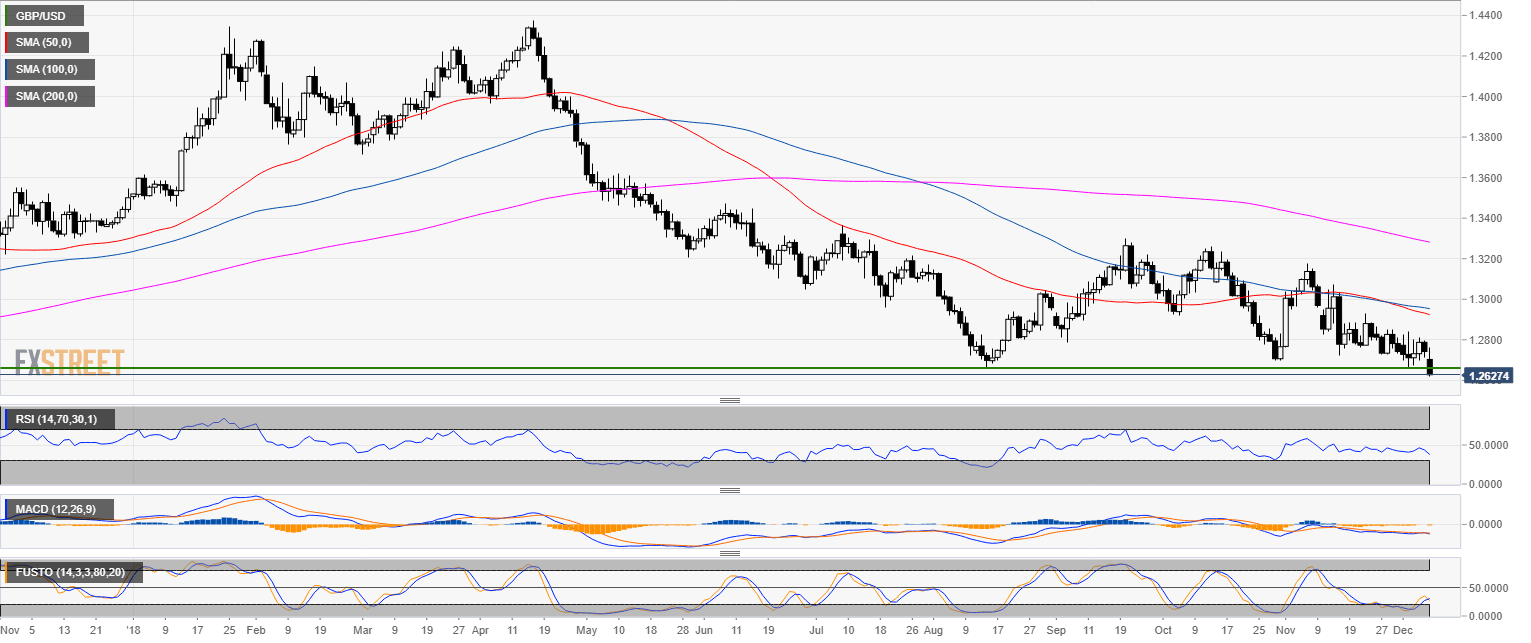
GBP/USD daily chart

  • GBP/USD is trading in a bear trend below the 50, 100 and 200-day simple moving average (SMA).
  • GBP/USD reached its lowest level since June 2017 as May could pull Brexit vote.

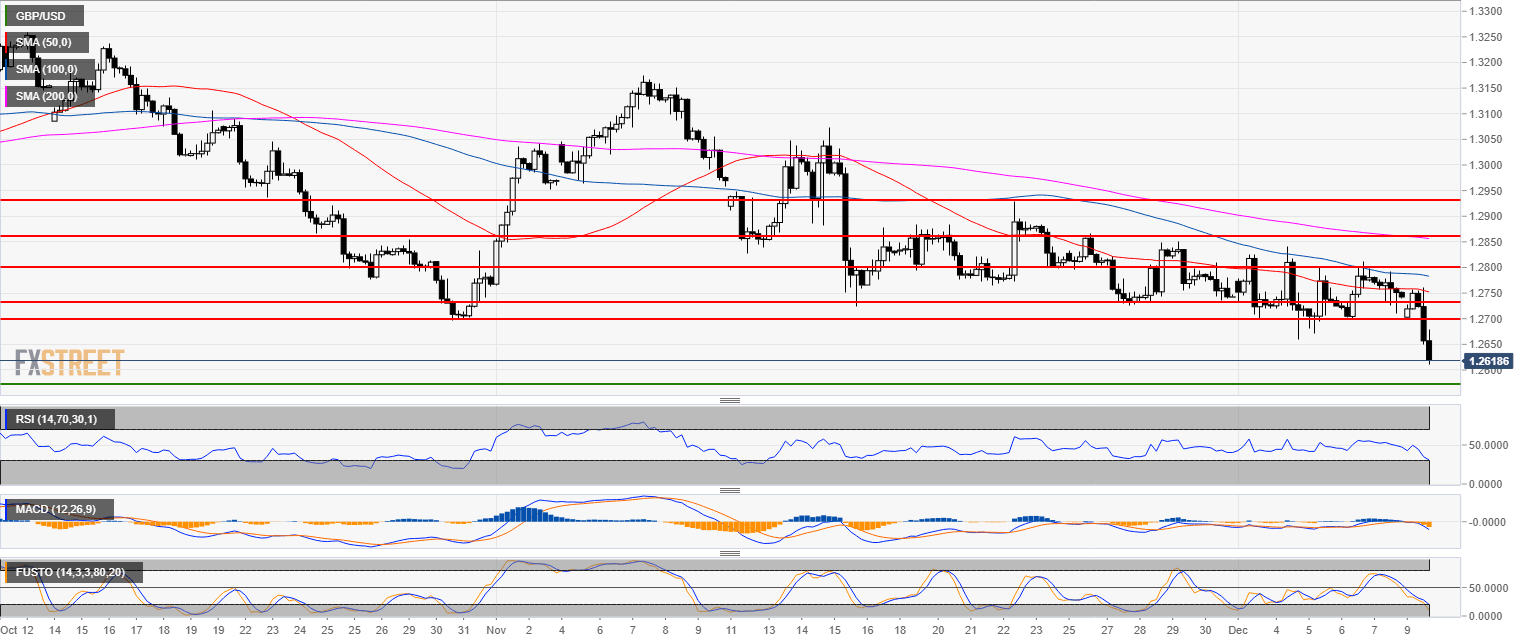
GBP/USD 4-hour chart

  • All indicators are in bearish mode.
  • The next support is seen at the 1.2561 level. 

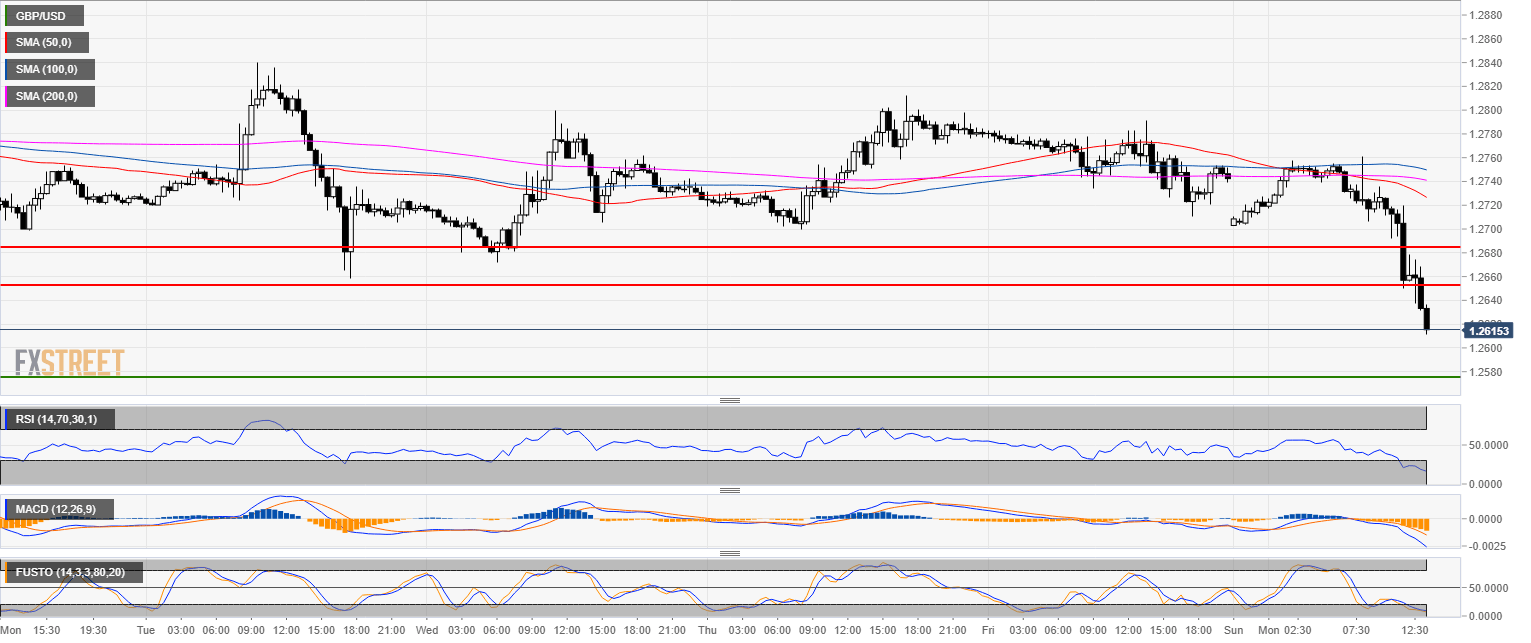
GBP/USD 30-minute chart

  • The momentum is bearish.
  • 1.2652 and 1.2681 should be fairly strong resistance to the upside. 

Additional key levels

GBP/USD

Overview:
    Today Last Price: 1.2618
    Today Daily change: -1.2e+2 pips
    Today Daily change %: -0.973%
    Today Daily Open: 1.2742
Trends:
    Previous Daily SMA20: 1.2806
    Previous Daily SMA50: 1.2932
    Previous Daily SMA100: 1.2958
    Previous Daily SMA200: 1.3288
Levels:
    Previous Daily High: 1.2812
    Previous Daily Low: 1.271
    Previous Weekly High: 1.284
    Previous Weekly Low: 1.2659
    Previous Monthly High: 1.3176
    Previous Monthly Low: 1.2723
    Previous Daily Fibonacci 38.2%: 1.2749
    Previous Daily Fibonacci 61.8%: 1.2773
    Previous Daily Pivot Point S1: 1.2698
    Previous Daily Pivot Point S2: 1.2654
    Previous Daily Pivot Point S3: 1.2597
    Previous Daily Pivot Point R1: 1.2799
    Previous Daily Pivot Point R2: 1.2856
    Previous Daily Pivot Point R3: 1.29

Author

Flavio Tosti

Flavio Tosti

Independent Analyst


More from Flavio Tosti
Share:

Editor's Picks

EUR/USD trims gains, back below 1.1800

EUR/USD now loses some upside momentum, returning to the area below the 1.1800 support as the Greenback manages to regain some composure following the SCOTUS-led pullback earlier in the session.

GBP/USD off highs, recedes to the sub-1.3500 area

Following earlier highs north of 1.3500 the figure, GBP/USD now faces some renewed downside pressure, revisiting the 1.3490 zone as the US Dollar manages to regain some upside impulse in the latter part of the NA session on Friday.

Gold climbs to weekly tops, approaches $5,100/oz

Gold keeps the bid tone well in place at the end of the week, now hitting fresh weekly highs and retargeting the key $5,100 mark per troy ounce. The move higher in the yellow metal comes in response to ongoing geopolitical tensions in the Middle East and modest losses in the US Dollar.

Crypto Today: Bitcoin, Ethereum, XRP rebound as risk appetite improves

Bitcoin rises marginally, nearing the immediate resistance of $68,000 at the time of writing on Friday. Major altcoins, including Ethereum and Ripple, hold key support levels as bulls aim to maintain marginal intraday gains.

Week ahead – Markets brace for heightened volatility as event risk dominates

Dollar strength dominates markets as risk appetite remains subdued. A Supreme Court ruling, geopolitics and Fed developments are in focus. Pivotal Nvidia earnings on Wednesday as investors question tech sector weakness.

Ripple bulls defend key support amid waning retail demand and ETF inflows

XRP ticks up above $1.40 support, but waning retail demand suggests caution. XRP attracts $4 million in spot ETF inflows on Thursday, signaling renewed institutional investor interest.