|
GBP/USD technical analysis: Cable remains bearish below 1.2900 handle
- GBP/USD is erasing parts of the intraday jump.
- The level to beat for bears is the 1.2835 and 1.2795 levels.

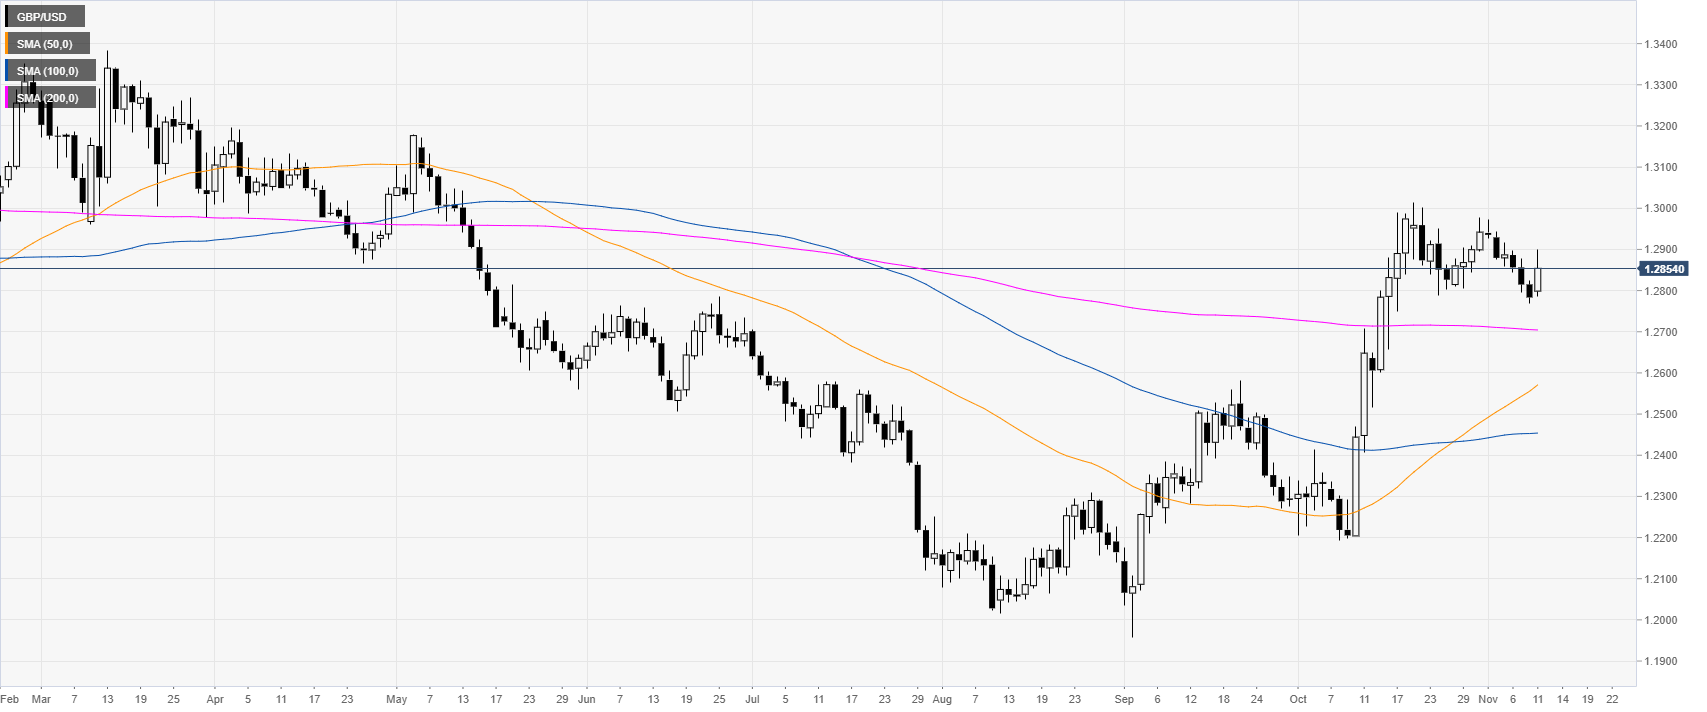
GBP/USD daily chart
The Cable, last month, had a rally to levels not seen since mid-May 2019. The market is currently correcting the advance in the 1.2800-1.3000 price zone.
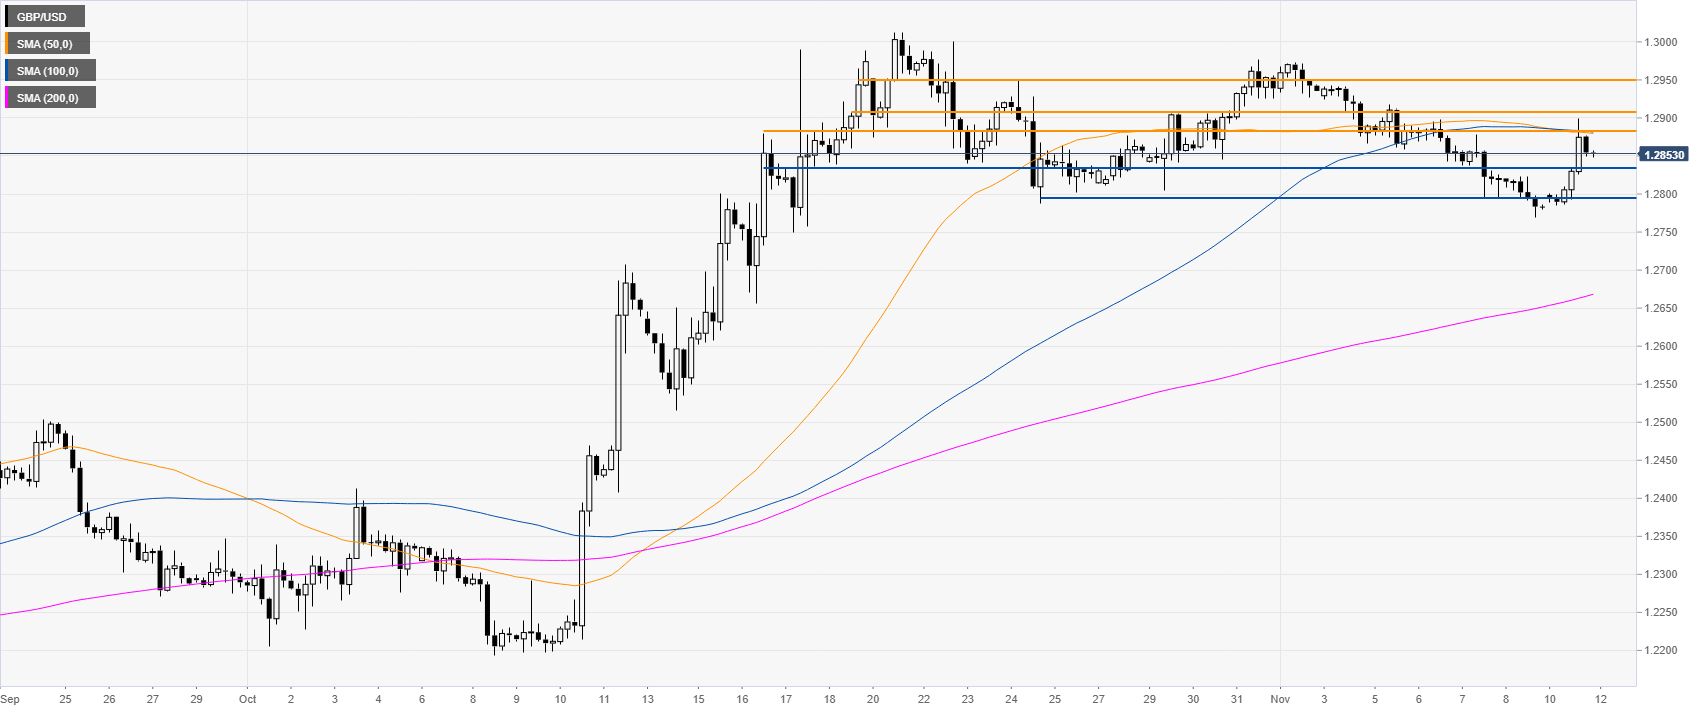
GBP/USD four-hour chart
GBP/USD is correcting below the 1.2882/1.2900 resistance zone and the 50/100 SMAs. Buyers would need to overcome this area on a daily basis in order to reclaim the 1.2950 resistance, according to the Technical Confluences Indicator.
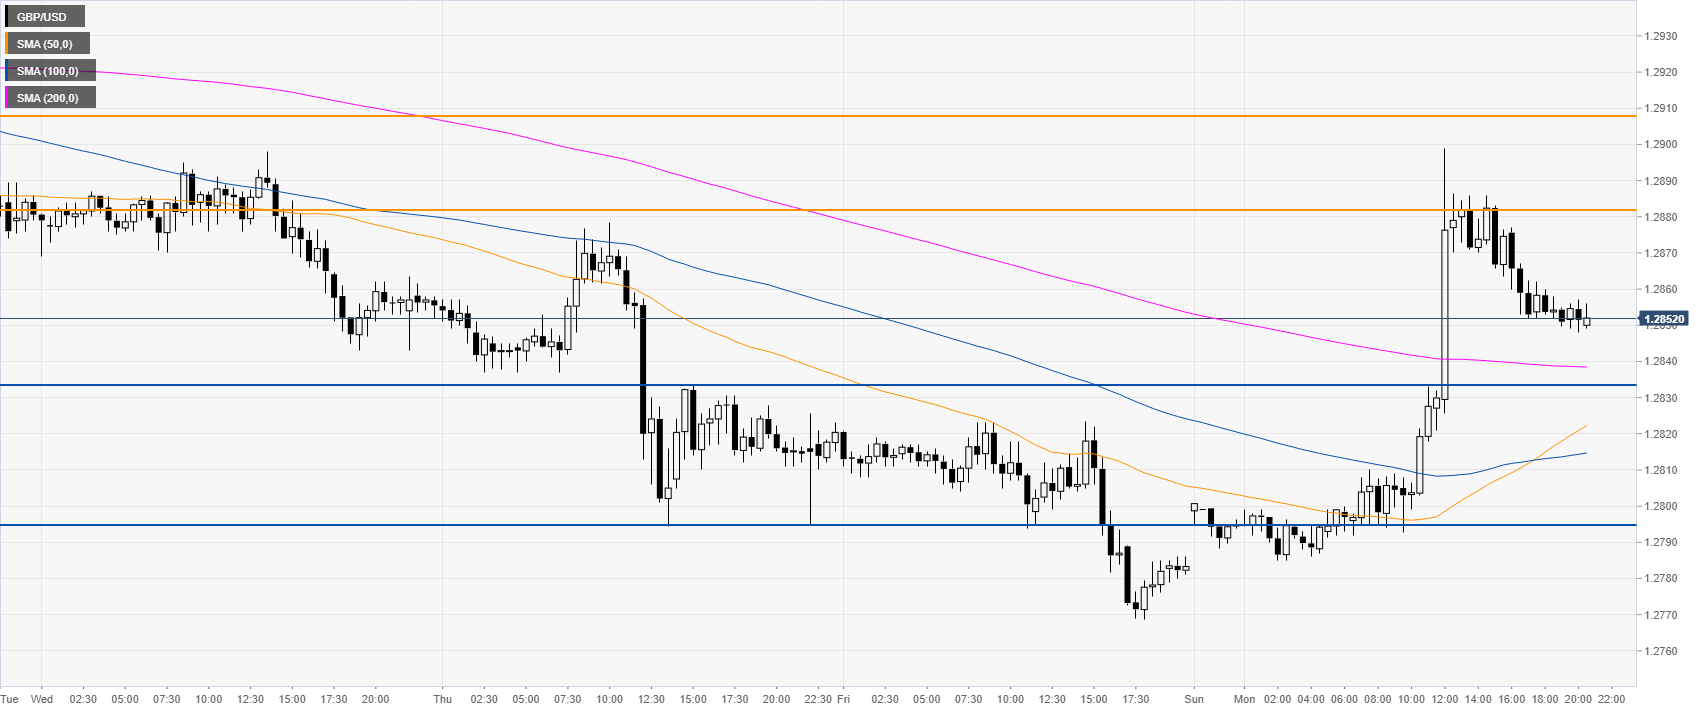
GBP/USD 30-minute chart
The Sterling is trading above downward sloping SMAs, suggesting a potential bullish attack in the near term. However, it seems more likely that the market continues to drift lower towards the 1.2835 and 1.2795 support levels, according to the Technical Confluences Indicator.
Additional key levels
Author

Flavio Tosti
Independent Analyst
More from Flavio Tosti


