|

GBP/USD technical analysis: Cable getting ready for something nasty?

  • GBP/USD is stuck in a range this Wednesday trading below the 1.2900 handle. 
  • GBP/USD is trapped in a triangle on the daily chart. 
  • Considering the Brexit drama, this can lead to a surprising move in either direction.
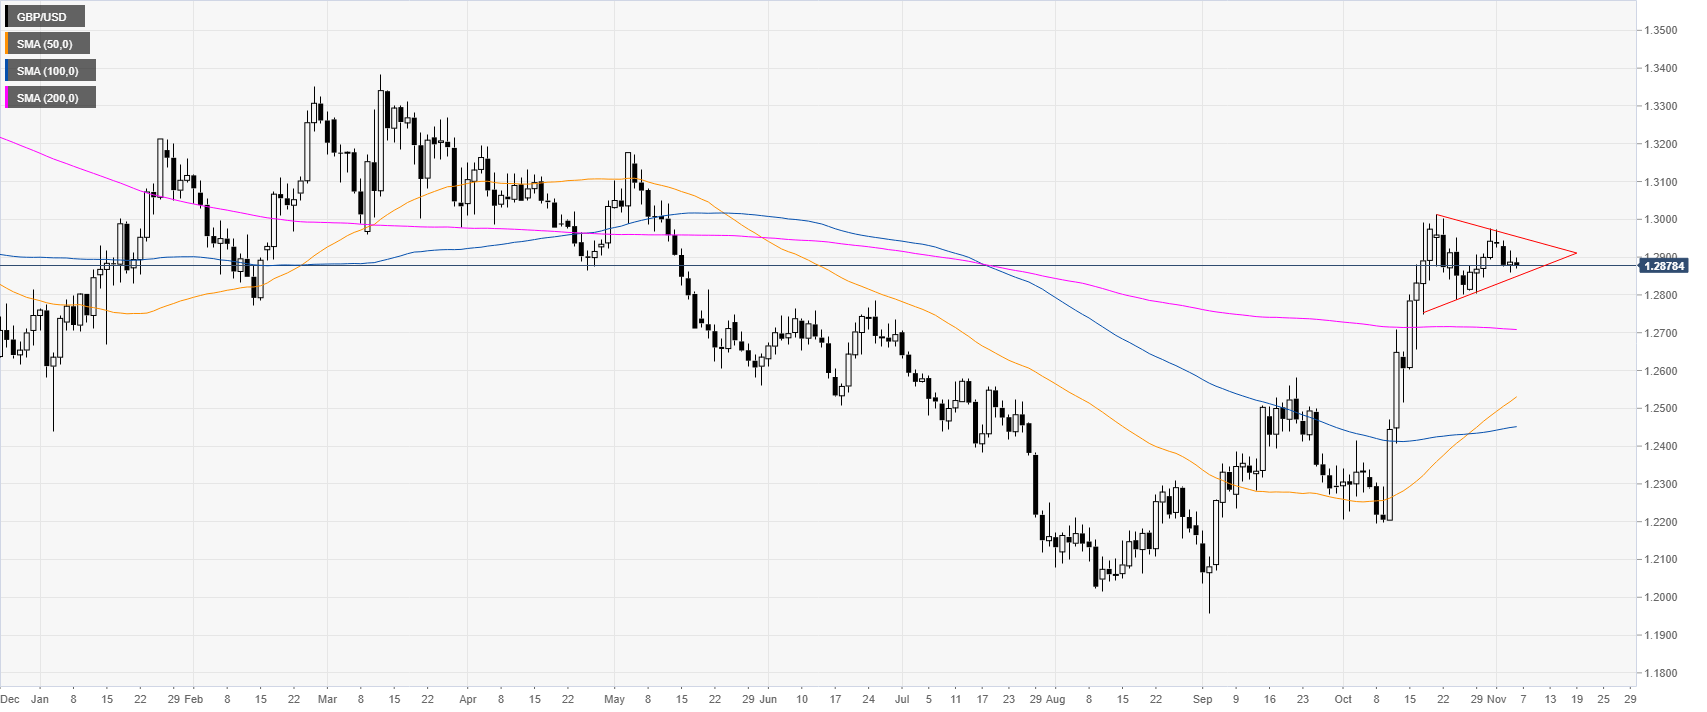
 

GBP/USD daily chart


In October, GBP/USD soared above the main daily simple moving averages (DMAs) and reached levels not seen since mid-May 2019. The Cable is currently trapped in a triangle pattern which can lead to significant moves in either direction as the Brexit drama unfolds.
 
https://editorial.fxstreet.com/miscelaneous/daily-637086493202122416.png

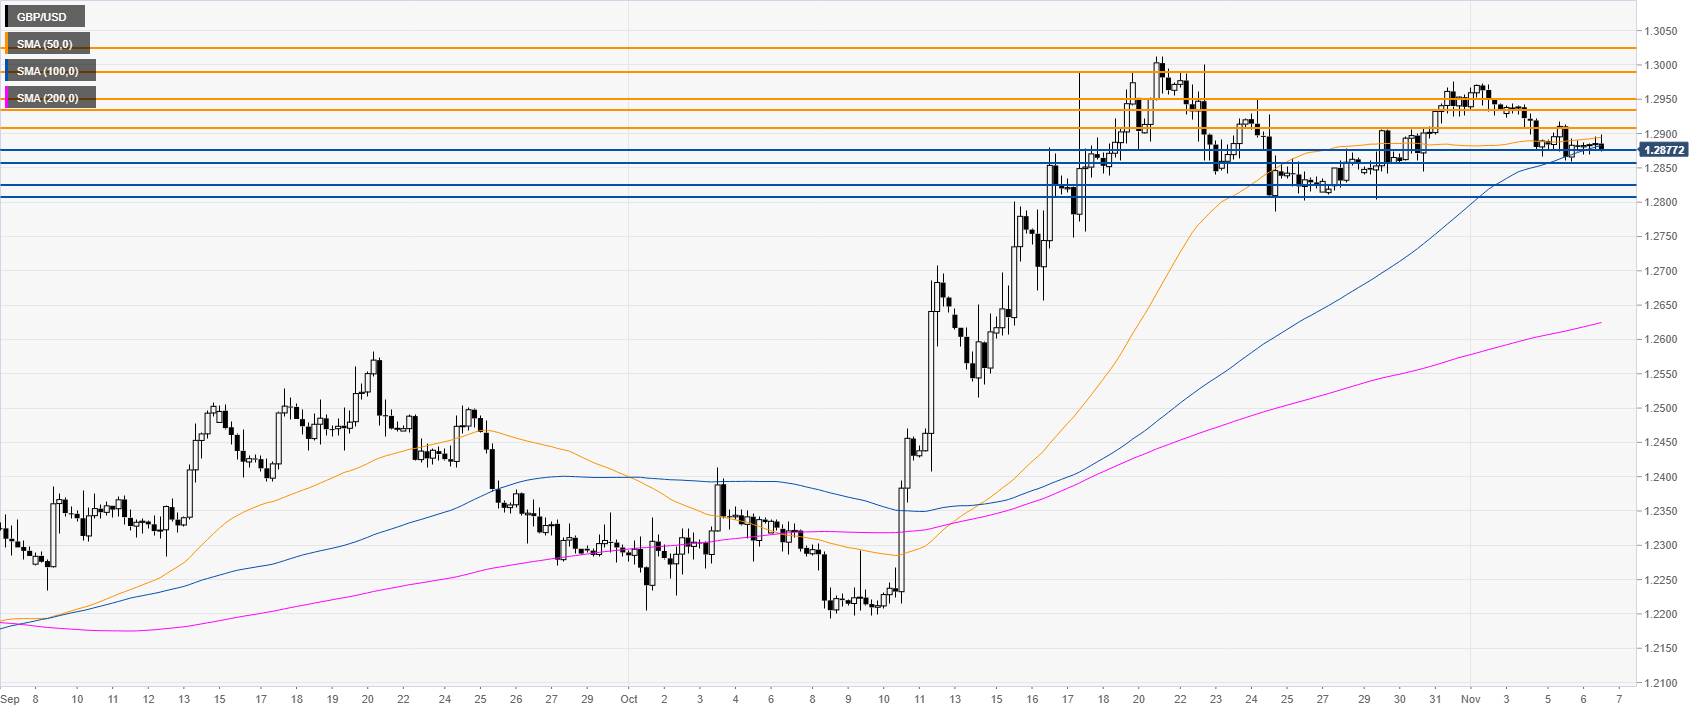
GBP/USD four-hour chart

 
GBP/USD is easing from the October and November highs while trading just below the 50 and 100 SMAs. The Cable is losing momentum suggesting that sellers might try to reach the 1.2887, 1.2860, 1.2825 and 1.2807 support levels on the way down, according to the Technical Confluences Indicator. 
 

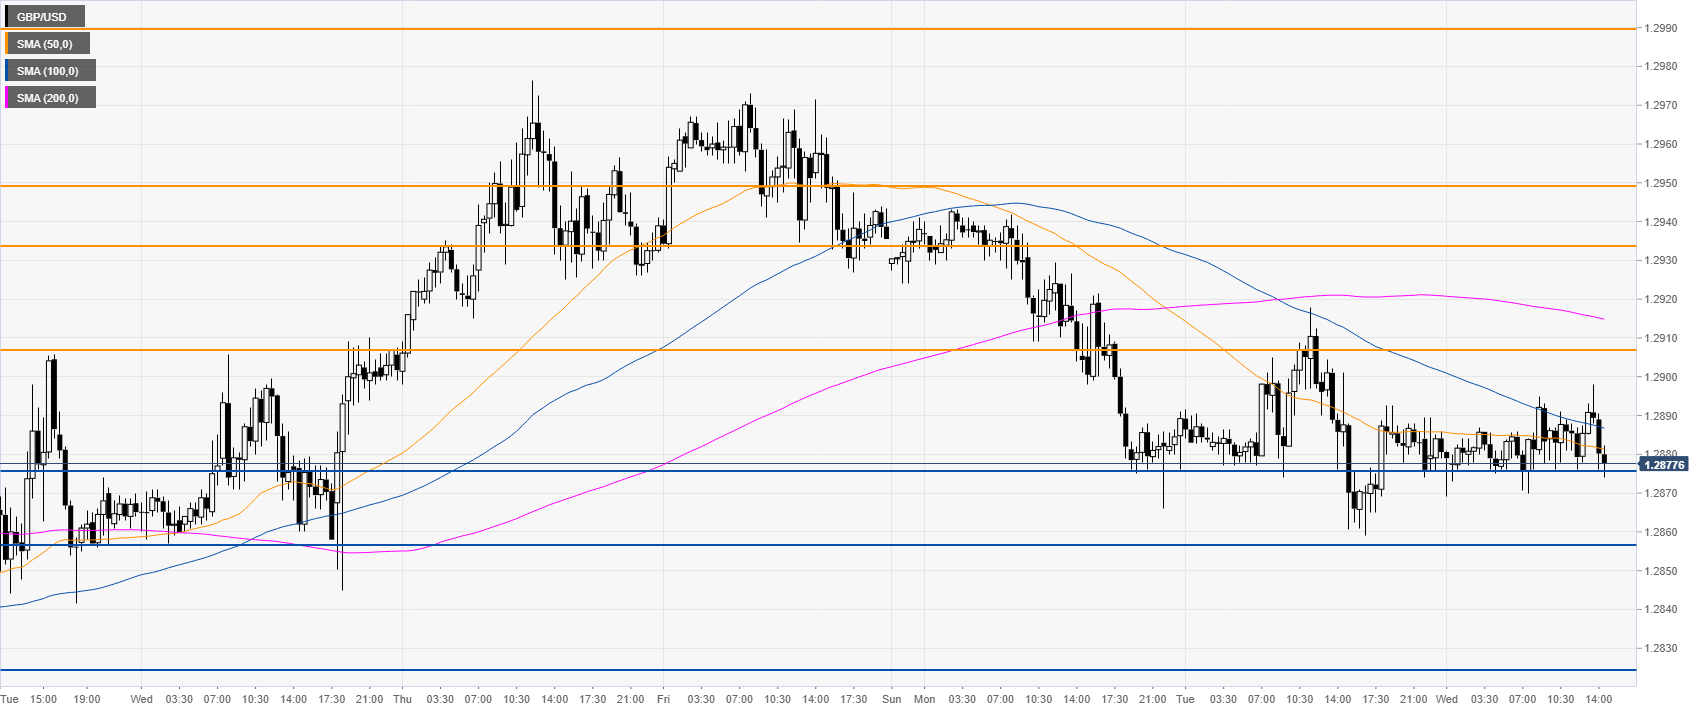
GBP/USD 30-minute chart


Sterling/Dollar is ranging this Wednesday while trading below its main SMAs. Immediate resistance is seen at the 1.2906 and the 1.2933 levels, according to the Technical Confluences Indicator. 
 

Additional key levels

GBP/USD

Overview
Today last price1.2874
Today Daily Change-0.0013
Today Daily Change %-0.10
Today daily open1.2887
 
Trends
Daily SMA201.2804
Daily SMA501.2517
Daily SMA1001.2449
Daily SMA2001.2709
 
Levels
Previous Daily High1.2918
Previous Daily Low1.2859
Previous Weekly High1.2976
Previous Weekly Low1.2804
Previous Monthly High1.3013
Previous Monthly Low1.2194
Daily Fibonacci 38.2%1.2895
Daily Fibonacci 61.8%1.2881
Daily Pivot Point S11.2858
Daily Pivot Point S21.2829
Daily Pivot Point S31.2799
Daily Pivot Point R11.2917
Daily Pivot Point R21.2947
Daily Pivot Point R31.2975

Author

Flavio Tosti

Flavio Tosti

Independent Analyst


More from Flavio Tosti
Share:

Editor's Picks

EUR/USD hits two-day highs near 1.1820

EUR/USD picks up pace and reaches two-day tops around 1.1820 at the end of the week. The pair’s move higher comes on the back of renewed weakness in the US Dollar amid growing talk that the Fed could deliver an interest rate cut as early as March. On the docket, the flash US Consumer Sentiment improves to 57.3 in February.

GBP/USD reclaims 1.3600 and above

GBP/USD reverses two straight days of losses, surpassing the key 1.3600 yardstick on Friday. Cable’s rebound comes as the Greenback slips away from two-week highs in response to some profit-taking mood and speculation of Fed rate cuts. In addition, hawkish comments from the BoE’s Pill are also collaborating with the quid’s improvement.

Gold climbs further, focus is back to 45,000

Gold regains upside traction and surpasses the $4,900 mark per troy ounce at the end of the week, shifting its attention to the critical $5,000 region. The move reflects a shift in risk sentiment, driving flows back towards traditional safe haven assets and supporting the yellow metal.

Crypto Today: Bitcoin, Ethereum, XRP rebound amid risk-off, $2.6 billion liquidation wave

Bitcoin edges up above $65,000 at the time of writing on Friday, as dust from the recent macro-triggered sell-off settles. The leading altcoin, Ethereum, hovers above $1,900, but resistance at $2,000 caps the upside. Meanwhile, Ripple has recorded the largest intraday jump among the three assets, up over 10% to $1.35.

Three scenarios for Japanese Yen ahead of snap election

The latest polls point to a dominant win for the ruling bloc at the upcoming Japanese snap election. The larger Sanae Takaichi’s mandate, the more investors fear faster implementation of tax cuts and spending plans. 

XRP rally extends as modest ETF inflows support recovery

Ripple is accelerating its recovery, trading above $1.36 at the time of writing on Friday, as investors adjust their positions following a turbulent week in the broader crypto market. The remittance token is up over 21% from its intraday low of $1.12.