|

GBP/USD technical analysis: Cable erases parts of intraday losses, trading sub-1.2260 level

  • GBP/USD is off the August high after hitting 1.2310 on Tuesday.
  • The levels to beat for bears are seen at 1.2211, followed by 1.2173 support levels.
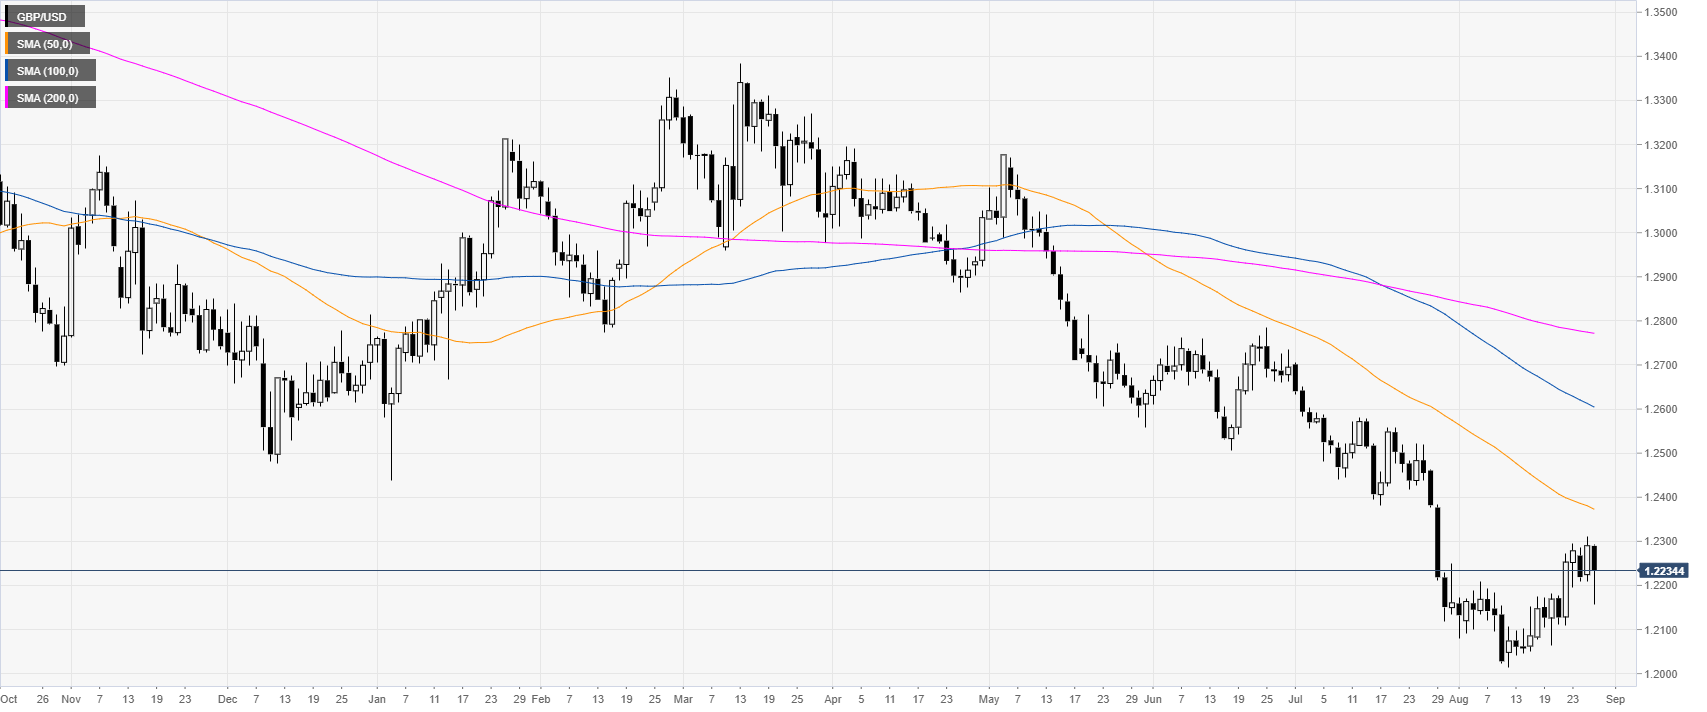
 

GBP/USD daily chart

 
GBP/USD is in a bear trend below the main daily simple moving averages (SMAs). However, in the last two and a half weeks, the Cable has been reversing up after printing a 2019 low at the 1.2015 level.

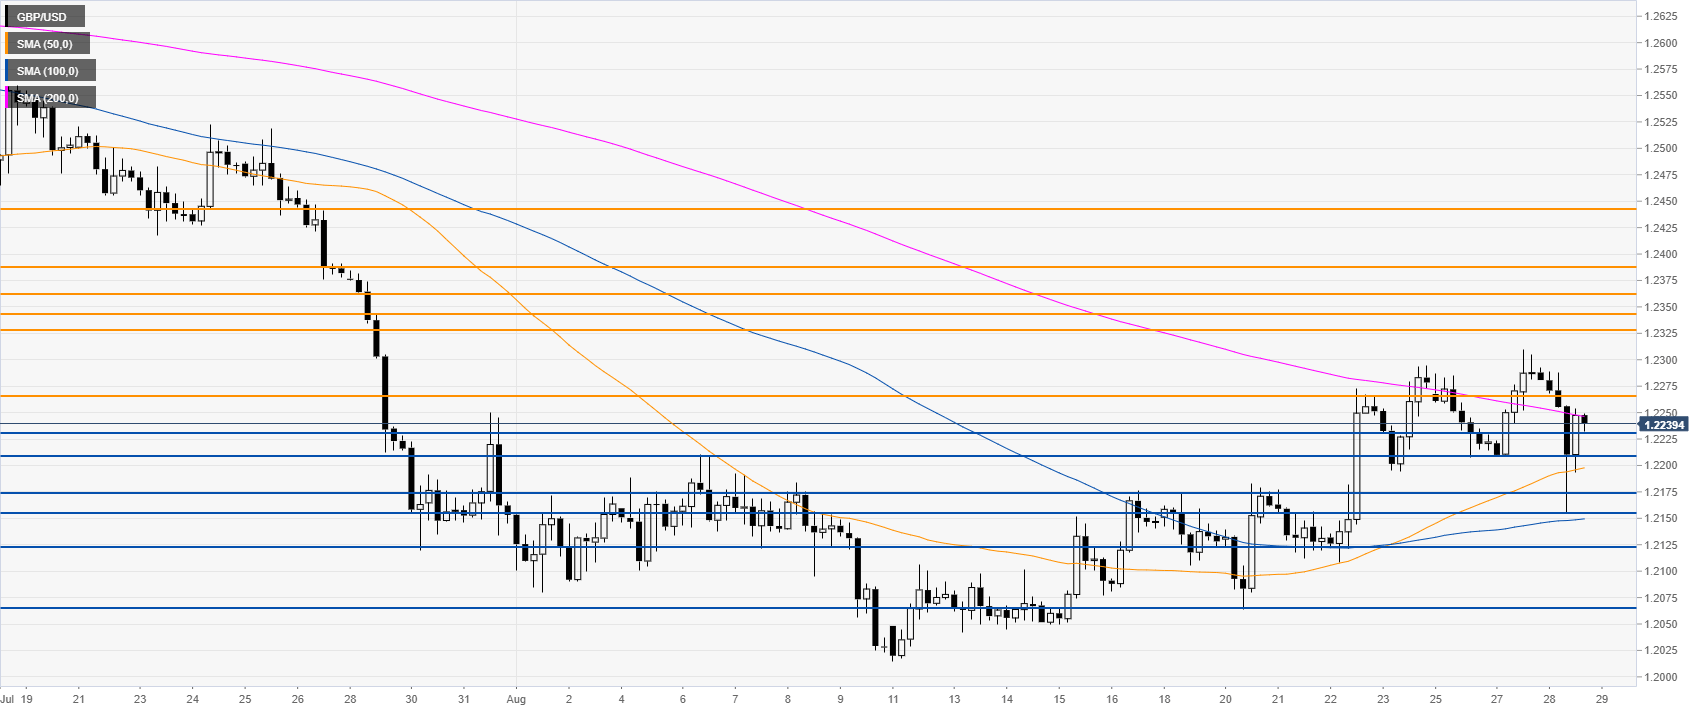
GBP/USD 4-hour chart

 
The Cable is trading between the 200 SMA (on the 4-hour time frame) and the 1.2230 support as the market is consolidating the recent spike down. Bears could come back and drive the market below the 1.2230 support towards 1.2211, 1.2173, 1.2122 and 1.2065 levels, according to the Technical Confluences Indicator.


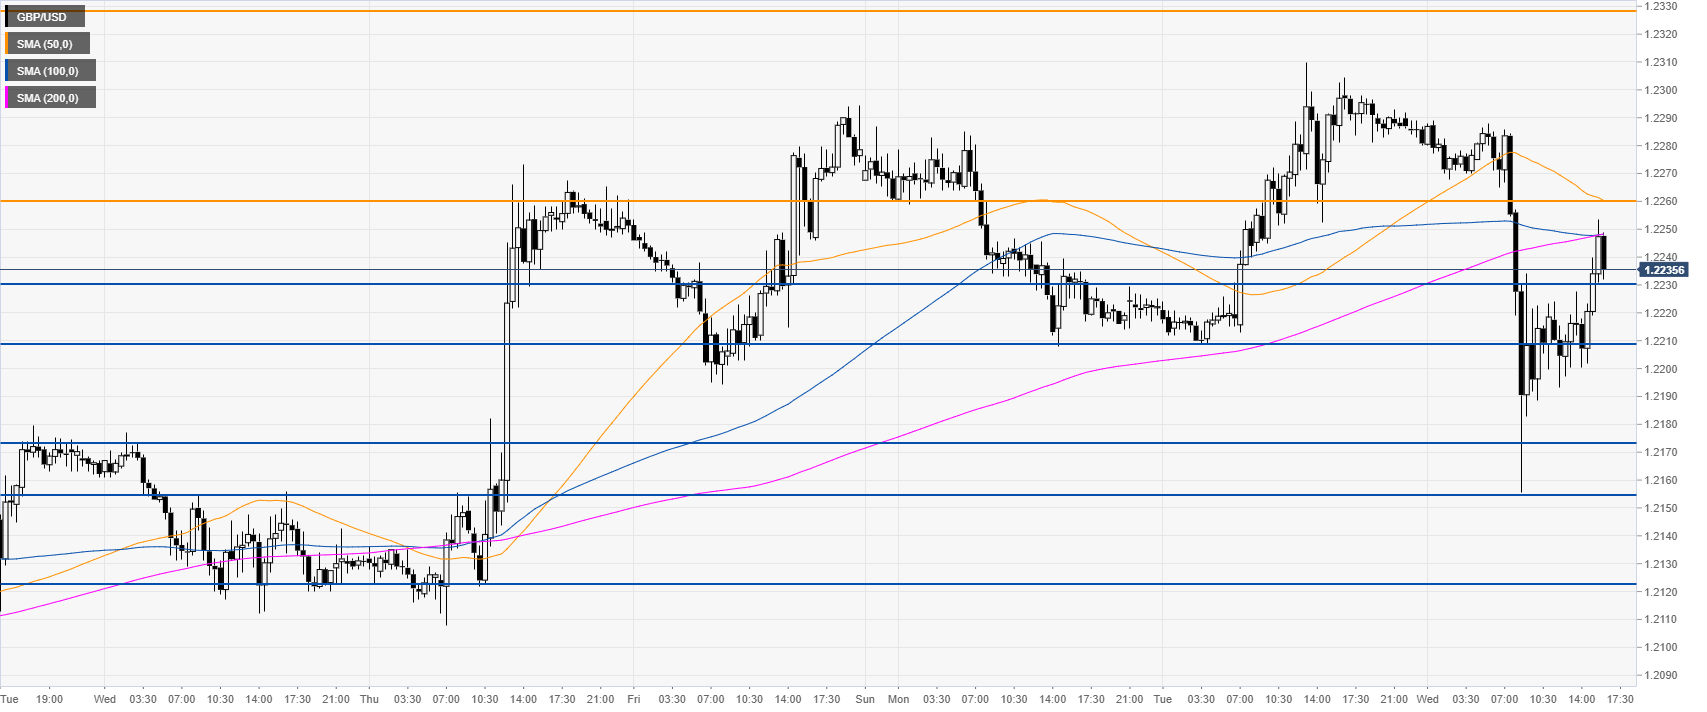
GBP/USD 30-minute chart

 
GBP/USD is trading just below its 100/200 SMAs, suggesting bearish momentum in the near term. Strong resistance is seen at the 1.2260 level, according to the Technical Confluences Indicator.

Additional key levels

GBP/USD

Overview
Today last price1.2235
Today Daily Change-0.0055
Today Daily Change %-0.45
Today daily open1.229
 
Trends
Daily SMA201.2148
Daily SMA501.2381
Daily SMA1001.2613
Daily SMA2001.2774
Levels
Previous Daily High1.231
Previous Daily Low1.2209
Previous Weekly High1.2294
Previous Weekly Low1.2064
Previous Monthly High1.2706
Previous Monthly Low1.2119
Daily Fibonacci 38.2%1.2271
Daily Fibonacci 61.8%1.2248
Daily Pivot Point S11.2229
Daily Pivot Point S21.2169
Daily Pivot Point S31.2128
Daily Pivot Point R11.233
Daily Pivot Point R21.2371
Daily Pivot Point R31.2431

Author

Flavio Tosti

Flavio Tosti

Independent Analyst


More from Flavio Tosti
Share:

Markets move fast. We move first.

Orange Juice Newsletter brings you expert driven insights - not headlines. Every day on your inbox.

By subscribing you agree to our Terms and conditions.

Editor's Picks

EUR/USD recovers to 1.1750 region as 2025 draws to a close

Following the bearish action seen in the European session on Wednesday, EUR/USD regains its traction and recovery to the 1.1750 region. Nevertheless, the pair's volatility remains low as trading conditions thin out on the last day of the year.

GBP/USD stays weak near 1.3450 on modest USD recovery

GBP/USD remains under modest beairsh pressure and fluctuates at around 1.3450 on Wednesday. The US Dollar finds fresh demand due to the end-of-the-year position adjustments, weighing on the pair amid the pre-New Year trading lull. 

Gold retreats to $4,300 area, looks to post monthly gains

Gold stays on the back foot on the last day of 2025 and trades near $4,300, possibly pressured by profit-taking and position adjustments. Nevertheless, XAU/USD remains on track to post gains for December and extend its winning streak into a fifth consecutive month.

Bitcoin, Ethereum and XRP prepare for a potential New Year rebound

Bitcoin, Ethereum, and Ripple are holding steady on Wednesday after recording minor gains on the previous day. Technically, Bitcoin could extend gains within a triangle pattern while Ethereum and Ripple face critical overhead resistance. 

Economic outlook 2026-2027 in advanced countries: Solidity test

After a year marked by global economic resilience and ending on a note of optimism, 2026 looks promising and could be a year of solid economic performance. In our baseline scenario, we expect most of the supportive factors at work in 2025 to continue to play a role in 2026.

Crypto market outlook for 2026

Year 2025 was volatile, as crypto often is.  Among positive catalysts were favourable regulatory changes in the U.S., rise of Digital Asset Treasuries (DAT), adoption of AI and tokenization of Real-World-Assets (RWA).