|
GBP/USD technical analysis: Cable clings to daily highs near 1.2865 after London close
- GBP/USD is trading near daily highs after the London close.
- The level to beat for buyers is the 1.2882/1.2900 resistance zone.

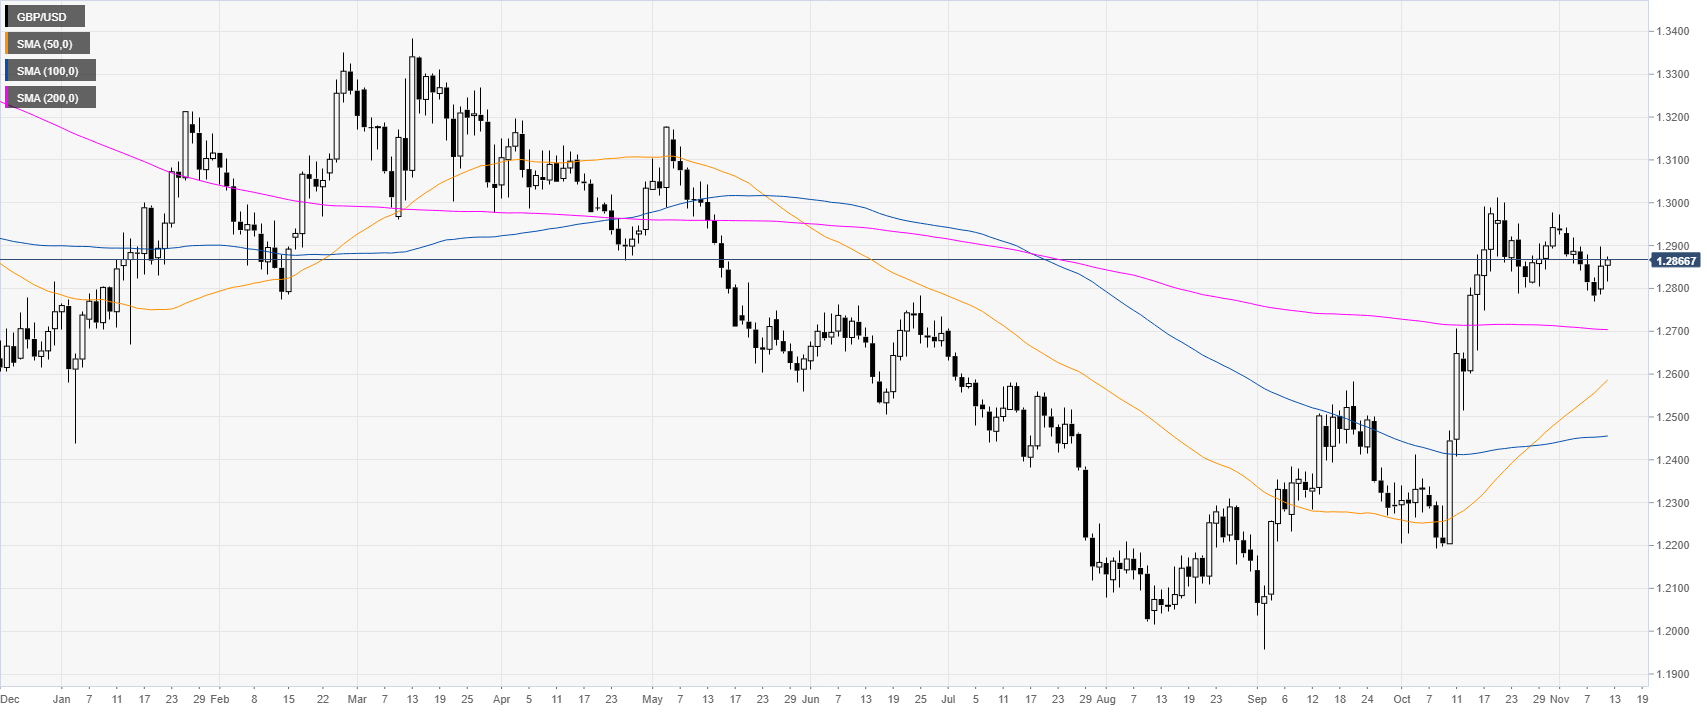
GBP/USD daily chart
The market is currently correcting the advance in the 1.2800-1.3000 price zone. The Cable, last month, had a bull run to levels not seen since mid-May 2019.
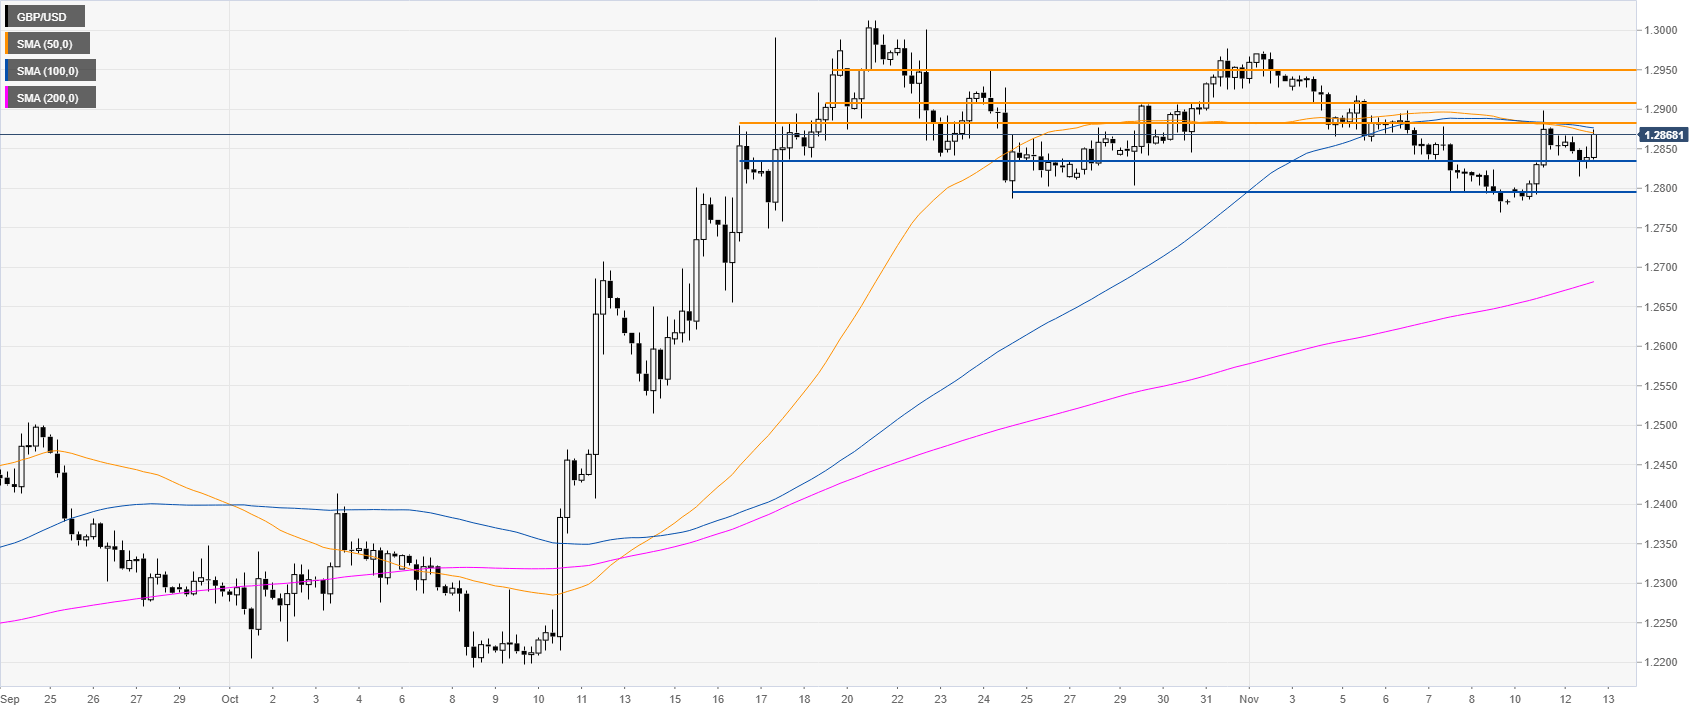
GBP/USD four-hour chart
GBP/USD is nearing the 1.2882/1.2900 resistance zone and the 50/100 SMAs. Bulls would need a break above this area on a daily basis in order to reclaim the 1.2950 resistance, according to the Technical Confluences Indicator.
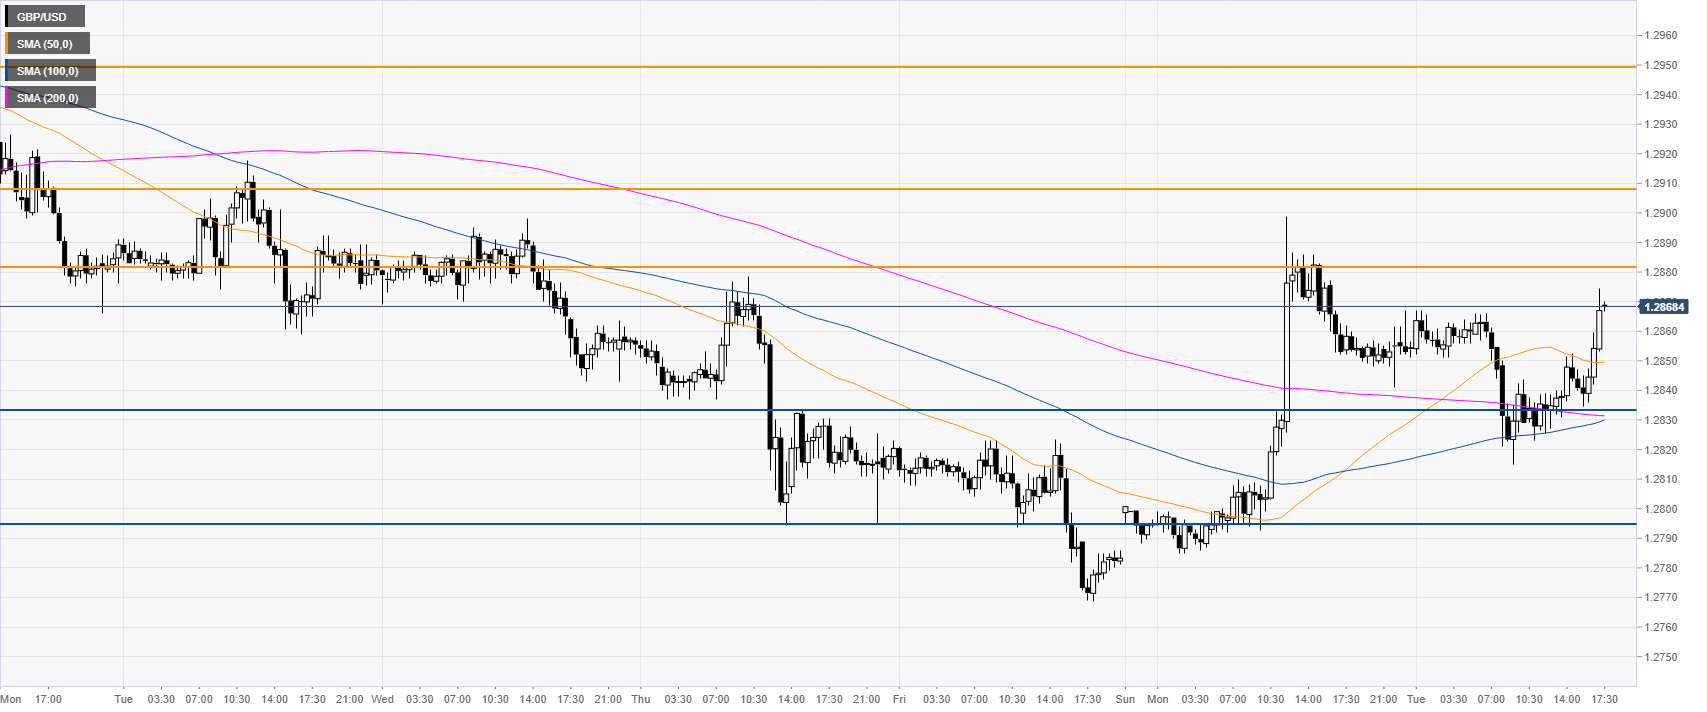
GBP/USD 30-minute chart
The Sterling is trading above its main SMAs, suggesting a potential bullish bias in the near term. It will be interesting to see if the market can break the 1.2882/1.2900 resistance zone. To the downside, 1.2835 and 1.2795 can act as support levels, according to the Technical Confluences Indicator.
Additional key levels
Author

Flavio Tosti
Independent Analyst
More from Flavio Tosti


