|

GBP/USD technical analysis: Cable battling with the 1.2200 level near daily lows

  • GBP/USD is trading off the August high after hitting the 1.2310 level on Tuesday.
  • The levels to beat for bears are seen at 1.2179, followed by 1.2156 support levels.
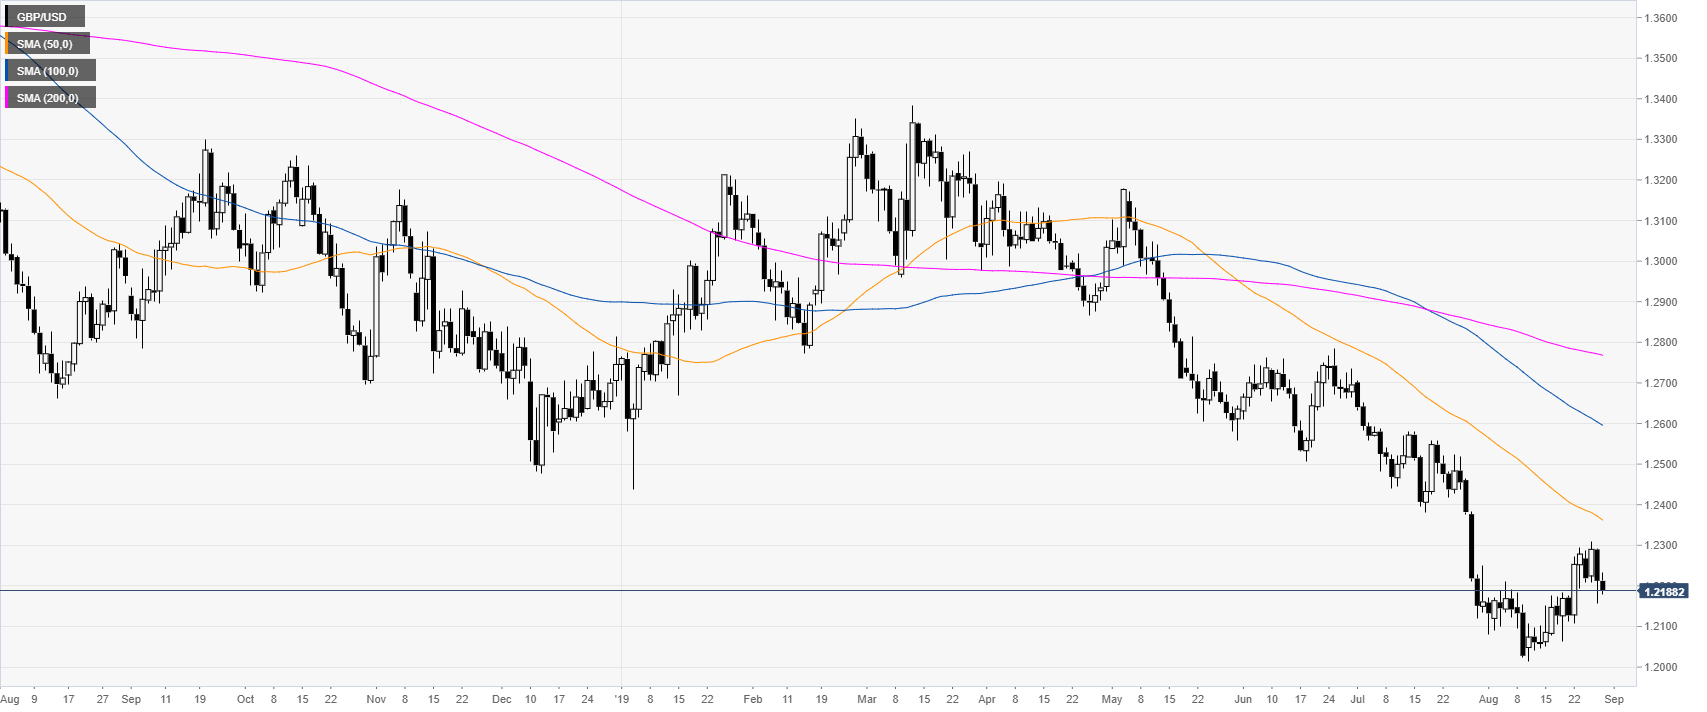
 

GBP/USD daily chart

 
The Sterling is in a bear trend below its main daily simple moving averages (SMAs). The market is down for the second day in a row.

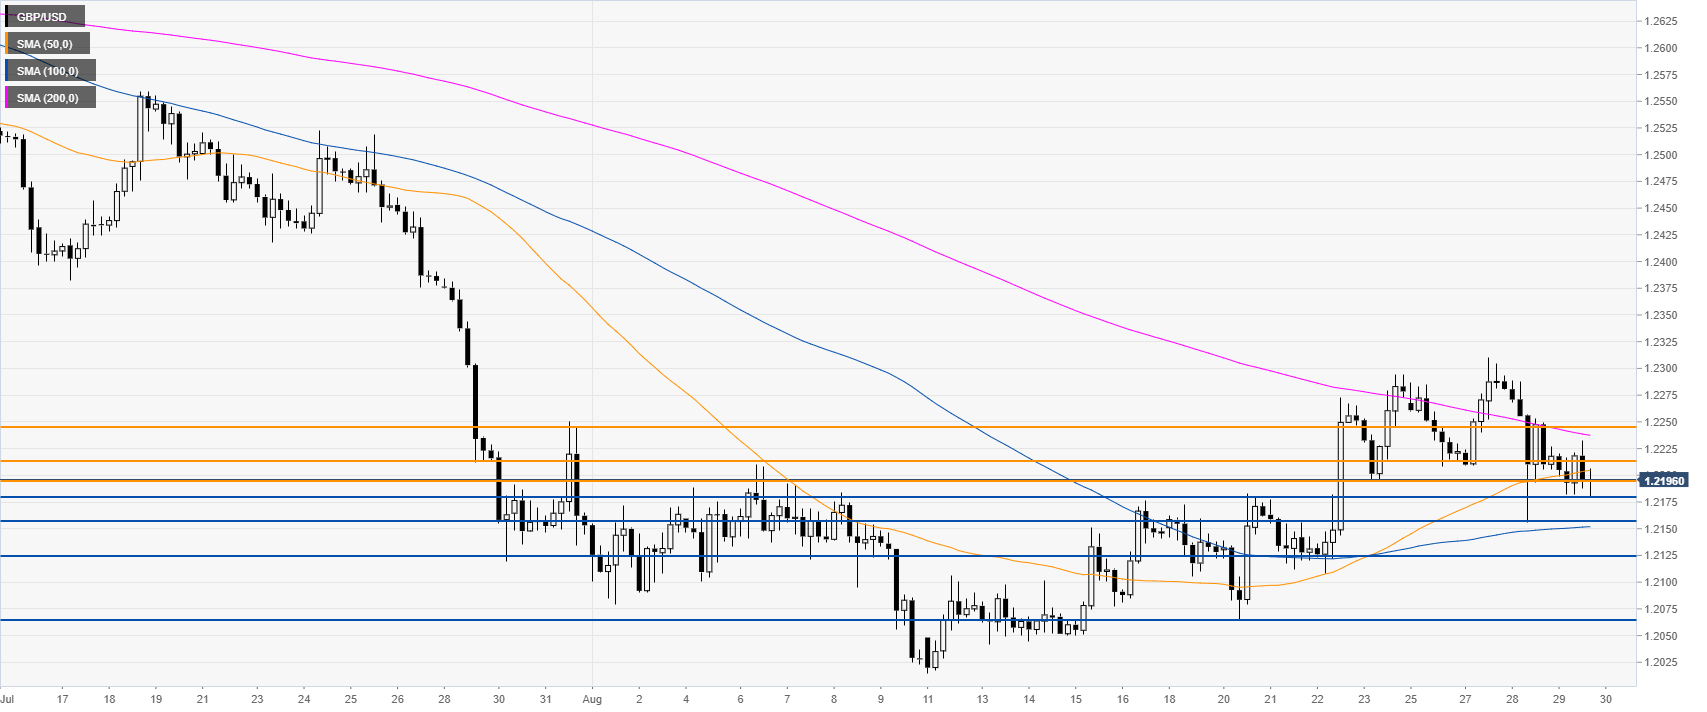
GBP/USD 4-hour chart

 
The Cable is trading below 1.2214 resistance and the 50/200 SMAs on the 4-hour time frame. Bears are most likely looking for a breakdown below 1.2179 support as well as the 1.2156, 1.2125 and 1.2065 levels, according to the Technical Confluences Indicator.


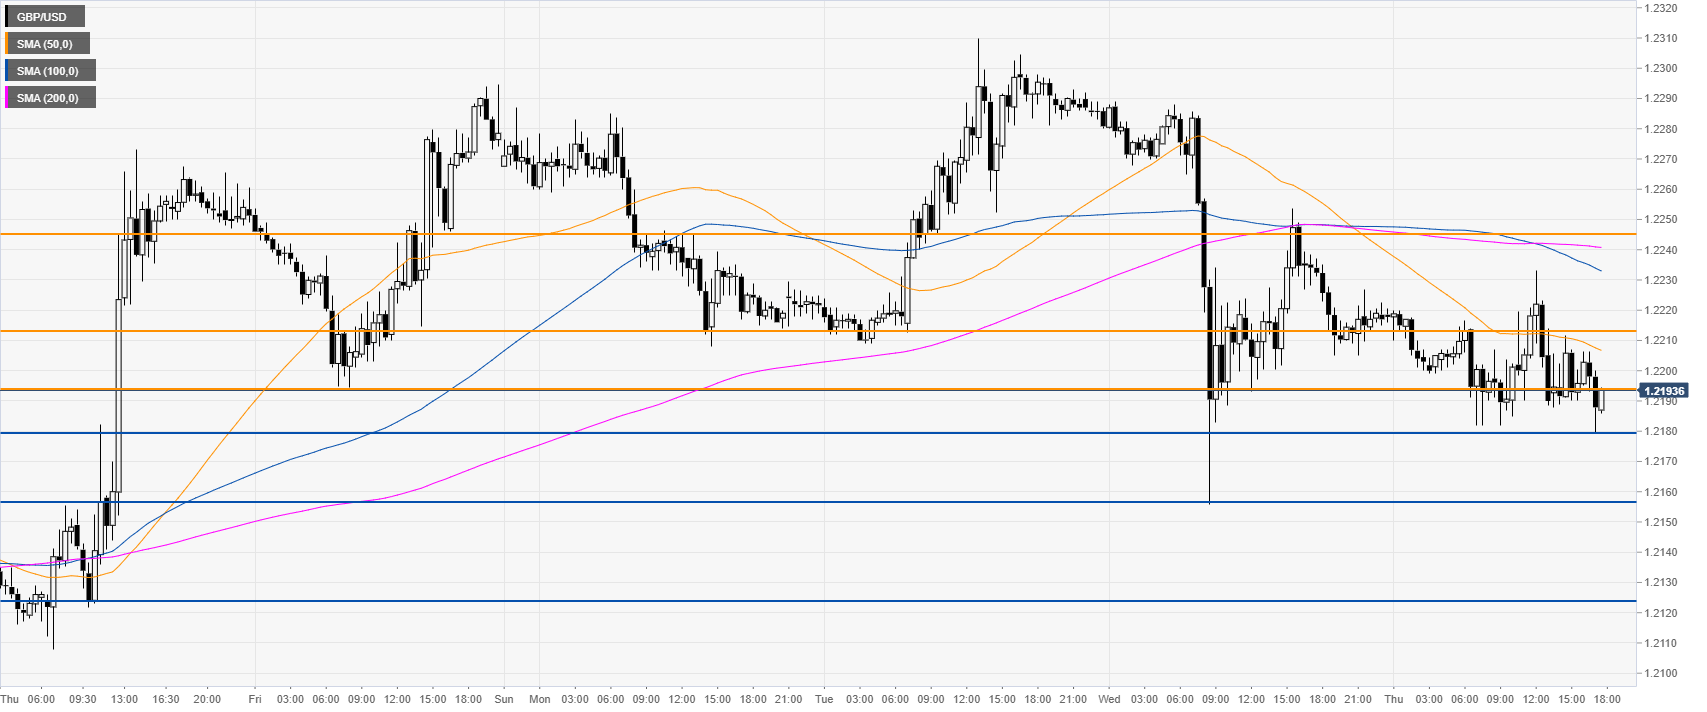
GBP/USD 30-minute chart

 
GBP/USD is trading below the main SMAs, suggesting a bearish bias in the near term. Immediate resistances are seen at the 1.2194, 1.2214 and 1.2245 levels, according to the Technical Confluences Indicator.

Additional key levels

GBP/USD

Overview
Today last price1.2188
Today Daily Change-0.0024
Today Daily Change %-0.20
Today daily open1.2212
 
Trends
Daily SMA201.2151
Daily SMA501.2372
Daily SMA1001.2604
Daily SMA2001.2772
Levels
Previous Daily High1.2293
Previous Daily Low1.2156
Previous Weekly High1.2294
Previous Weekly Low1.2064
Previous Monthly High1.2706
Previous Monthly Low1.2119
Daily Fibonacci 38.2%1.2208
Daily Fibonacci 61.8%1.2241
Daily Pivot Point S11.2148
Daily Pivot Point S21.2083
Daily Pivot Point S31.201
Daily Pivot Point R11.2285
Daily Pivot Point R21.2358
Daily Pivot Point R31.2422

Author

Flavio Tosti

Flavio Tosti

Independent Analyst


More from Flavio Tosti
Share:

Markets move fast. We move first.

Orange Juice Newsletter brings you expert driven insights - not headlines. Every day on your inbox.

By subscribing you agree to our Terms and conditions.

Editor's Picks

EUR/USD bounces toward 1.1750 as US Dollar loses strength

EUR/USD returned to the 1.1750 price zone in the American session on Friday, despite falling Wall Street, which indicates risk aversion. Trading conditions remain thin following the New Year holiday and ahead of the weekend, with the focus shifting to US employment and European data scheduled for next week.

GBP/USD nears 1.3500, holds within familiar levels

After testing 1.3400 on the last day of 2025, GBP/USD managed to stage a rebound. Nevertheless, the pair finds it difficult to gather momentum and trades with modest intraday gains at around 1.3490 as market participants remain in holiday mood.

Gold trims intraday gains, approaches $4,300

Gold retreated sharply from the $4,400  area and trades flat for the day in the $4,320 price zone. Choppy trading conditions exacerbated the intraday decline, although XAU/USD bearish case is out of the picture, considering growing expectations for a dovish Fed and persistent geopolitical tensions.

Cardano gains early New Year momentum, bulls target falling wedge breakout

Cardano kicks off the New Year on a positive note and is extending gains, trading above $0.36 at the time of writing on Friday. Improving on-chain and derivatives data point to growing bullish interest, while the technical outlook keeps an upside breakout in focus.

Economic outlook 2026-2027 in advanced countries: Solidity test

After a year marked by global economic resilience and ending on a note of optimism, 2026 looks promising and could be a year of solid economic performance. In our baseline scenario, we expect most of the supportive factors at work in 2025 to continue to play a role in 2026.

Crypto market outlook for 2026

Year 2025 was volatile, as crypto often is.  Among positive catalysts were favourable regulatory changes in the U.S., rise of Digital Asset Treasuries (DAT), adoption of AI and tokenization of Real-World-Assets (RWA).