|
GBP/USD technical analysis: Cable at daily lows loses the 1.2300 handle
- The Sterling is trading at daily lows mimicking in a much tamer fashing EUR/USD.
- The level to beat for bears is at 1.2260 support.

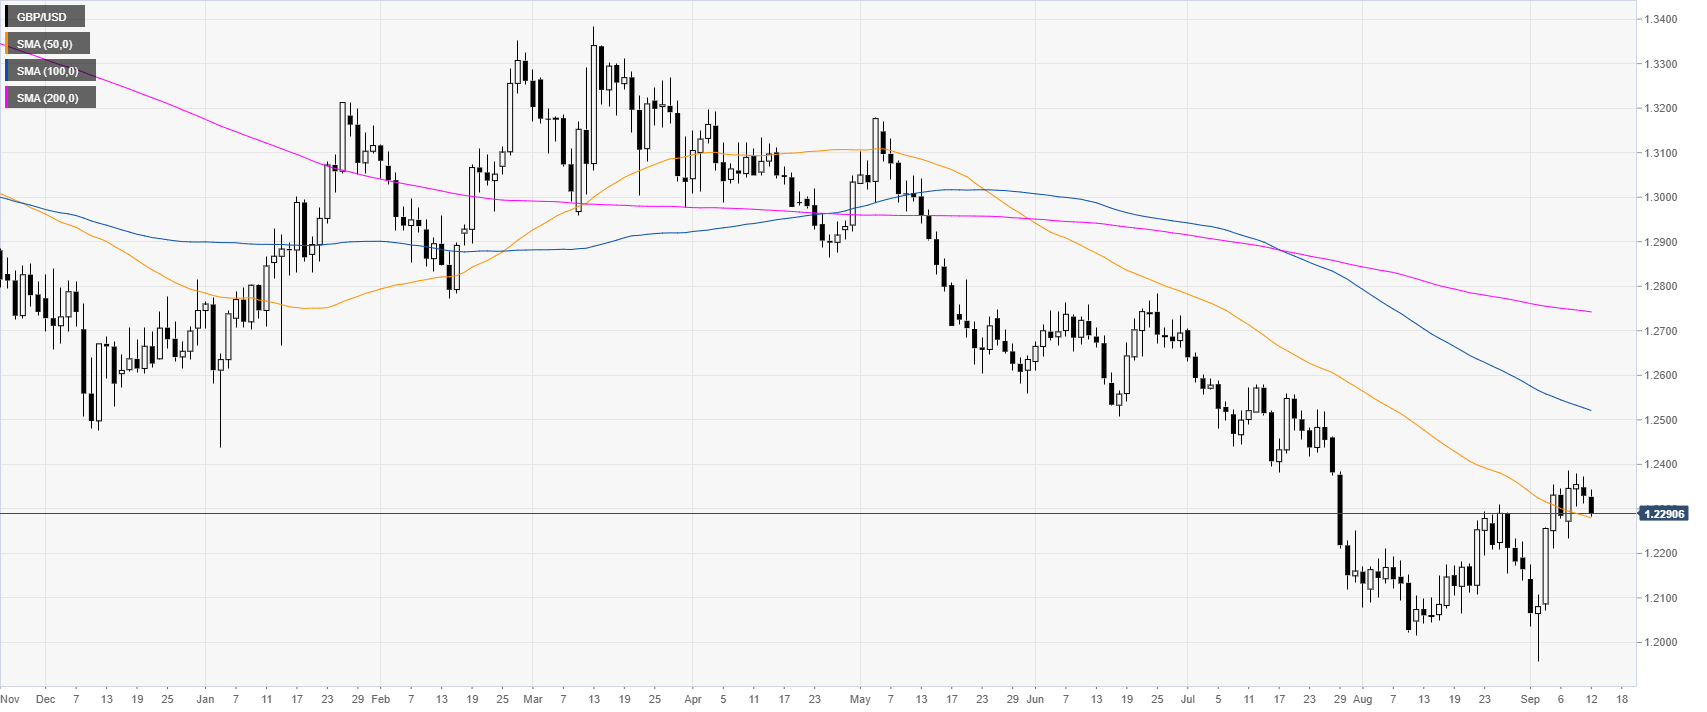
GBP/USD daily chart
The Sterling is trading in a bear trend below the 100 and 200-day simple moving averages (SMAs). GBP/USD is consolidating its recent advance below the 1.2400 figure.
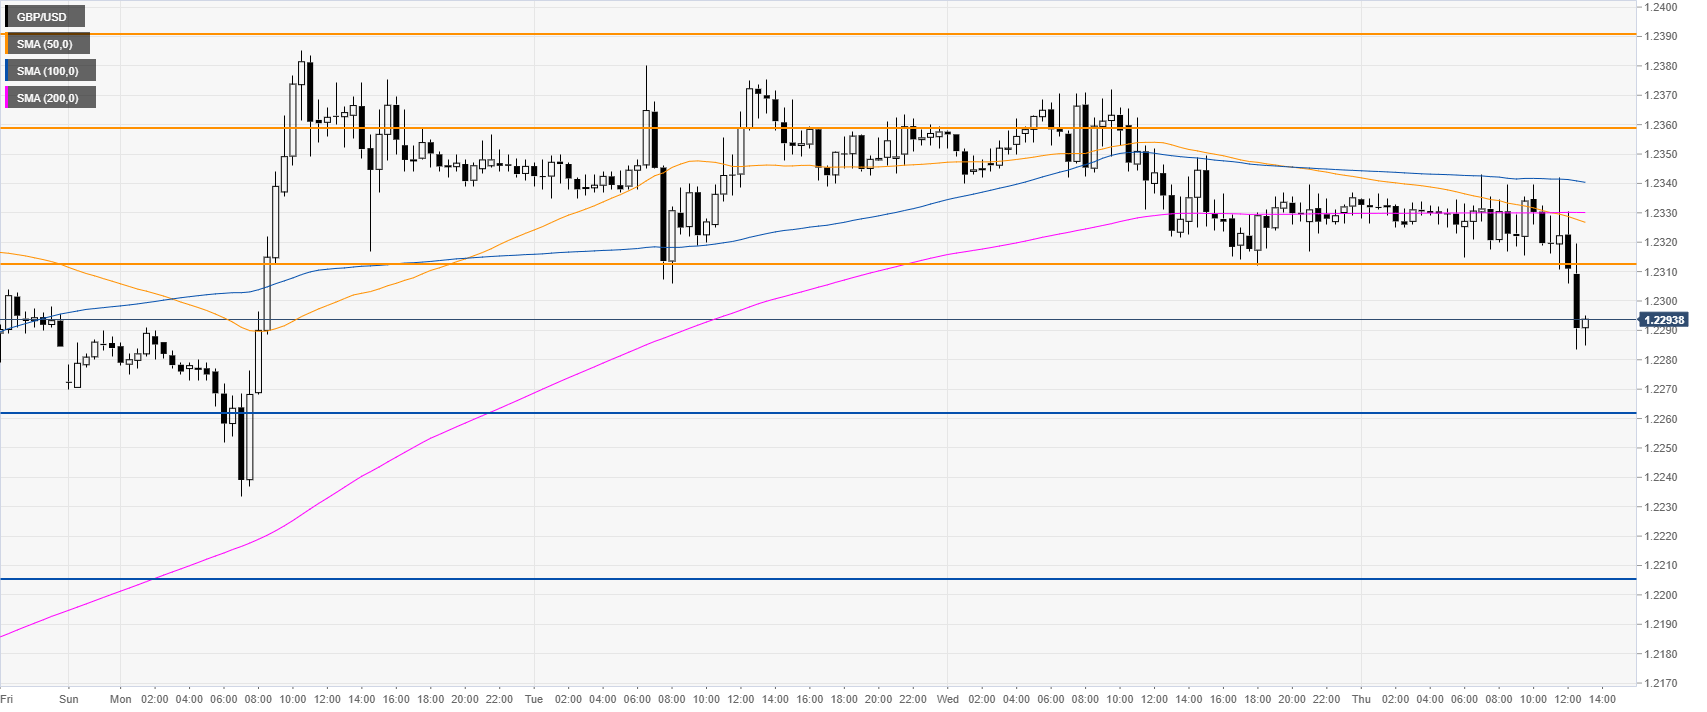
GBP/USD four-hour chart
GBP/USD slipped below the 1.2313 support as the market is trading above its main SMAs. As the market is losing steam, it might be correcting down towards 1.2260 and 1.2205 support levels, according to the Technical Confluences Indicator.

GBP/USD 30-minute chart
The Sterling is trading below the main SMAs, suggesting bearish momentum in the near term. Immediate resistance is seen at the 1.2313 level, according to the Technical Confluences Indicator.
Additional key levels
Author

Flavio Tosti
Independent Analyst
More from Flavio Tosti


