|

GBP/USD Technical Analysis: Cable advancing to 3-day’s high amidst Brexit saga and ahead of FOMC
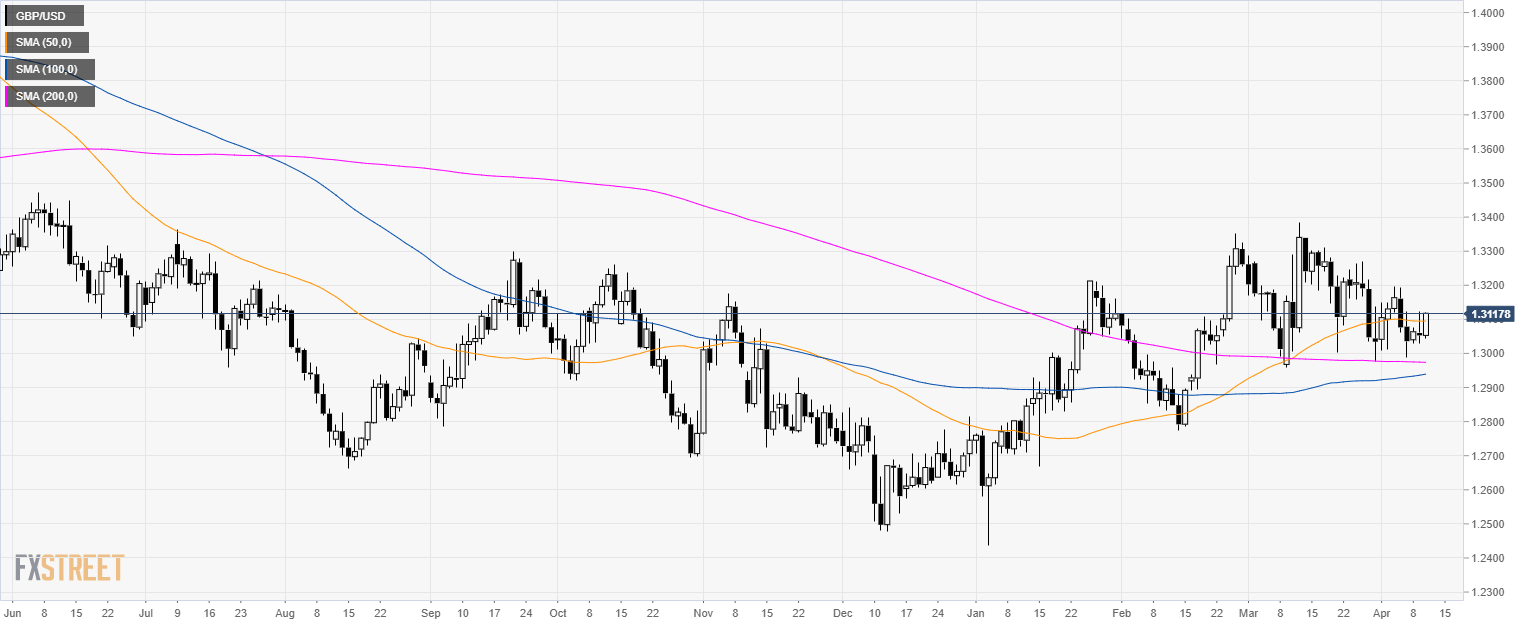
GBP/USD daily chart

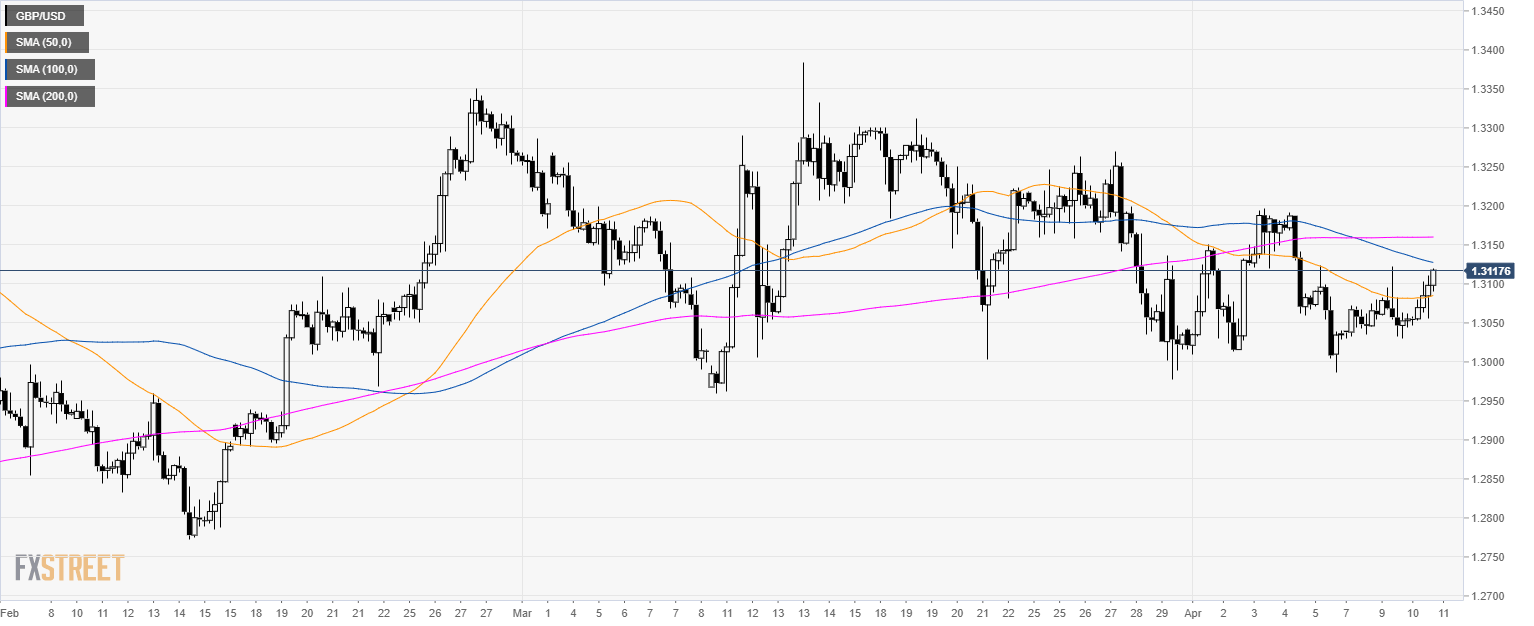
GBP/USD 4-hour chart

  • GBP/USD is rising towards the 100 SMA.


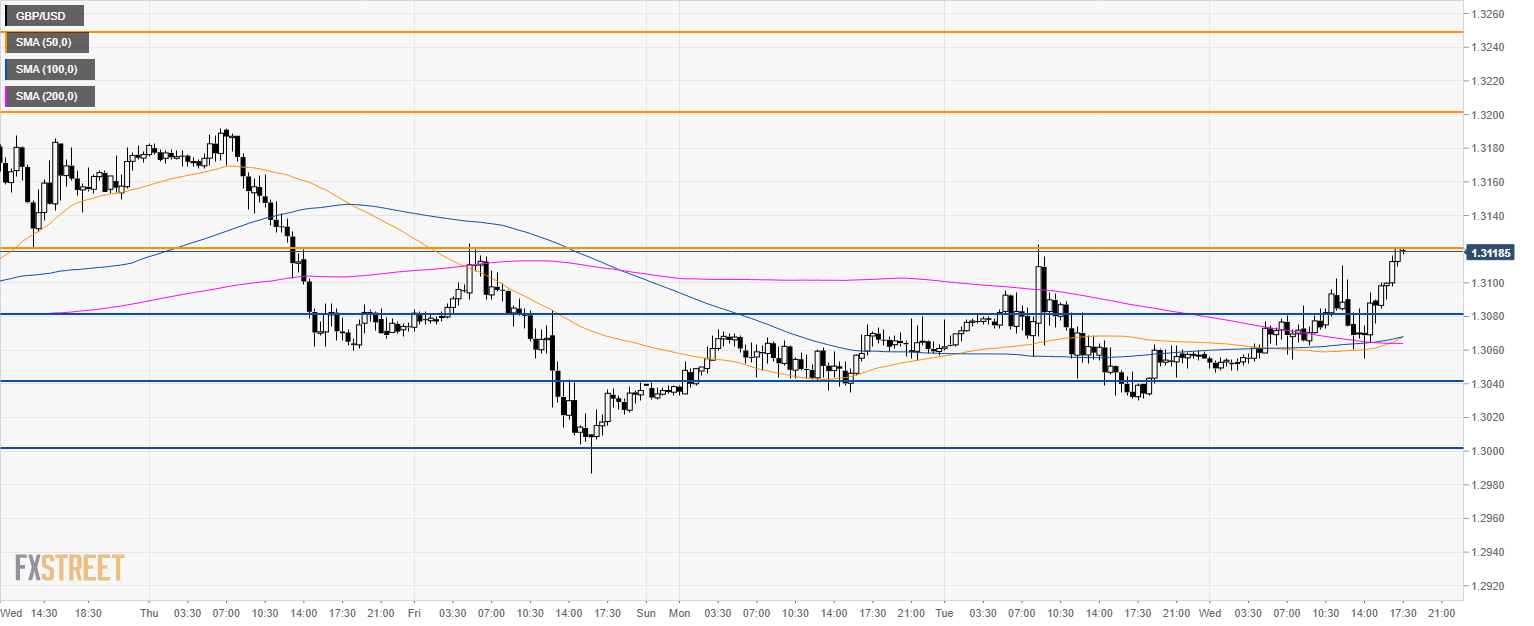
GBP/USD 30-minute chart

  • GBP/USD is challenging the 1.3120 resistance. Buyers seem to be in charge which could potentially lead to a bullish continuation to 1.3200 and 1.3250 resistance.
  • The main supports to the downside are seen at 1.3080, 1.3040 and 1.3000 level.

Additional key levels

GBP/USD

Overview
Today last price1.3121
Today Daily Change0.0068
Today Daily Change %0.52
Today daily open1.3053
 
Trends
Daily SMA201.3161
Daily SMA501.3095
Daily SMA1001.2936
Daily SMA2001.2974
Levels
Previous Daily High1.3122
Previous Daily Low1.303
Previous Weekly High1.3196
Previous Weekly Low1.2987
Previous Monthly High1.3384
Previous Monthly Low1.296
Daily Fibonacci 38.2%1.3065
Daily Fibonacci 61.8%1.3087
Daily Pivot Point S11.3014
Daily Pivot Point S21.2976
Daily Pivot Point S31.2922
Daily Pivot Point R11.3107
Daily Pivot Point R21.3161
Daily Pivot Point R31.3199

Author

Flavio Tosti

Flavio Tosti

Independent Analyst


More from Flavio Tosti
Share:

Editor's Picks

EUR/USD keeps the offered stance just above 1.1700

EUR/USD is coming under heavy selling pressure in what has been a rather grim start to the new trading week, with the pair now trading close to the 1.1700 support area as the US Dollar stages a solid rebound. The prevailing flight to safety mood continues to favour the Greenback, as investors react to the escalating conflict in the Middle East and trim risk exposure across the board.

GBP/USD hits new yearly lows near 1.3300

GBP/USD adds to the recent bearish tone, approaching to the key 1.3300 support to reach fresh YTD troughs against the backdrop of the robust performance of the US Dollar. Indeed, Cable’s decline comes amid the firm demand for the safe-haven space in the wake of the US and Israel attacks to Iran.

Gold trims losses, back below $5,400

Gold now surrenders part of the earlier advance past the $5,400 mark per troy ounce at the beginning of the week. Indeed, the precious metal’s strong uptick remains fuelled by increasing geopolitical tensions in the Middle East amid the intense demand for safer assets.

Bitcoin on brink of breakdown amid US-Iran war

Bitcoin (BTC) remains under pressure near the key support level of $65,700. Trading at $66,400 at the time of writing on Monday, a breakdown below this critical level would suggest a deeper correction ahead.

The Fed is finally talking about AI – Here's why it matters for the US Dollar

AI is moving from earnings calls into the heart of monetary policy discussions, forcing Federal Reserve officials to confront a new question: How to act if AI reshapes inflation, employment and interest rates at the same time?

Pi Network Price Forecast: Core team offloads supply, weighing on PI recovery

Pi Network  hovers below $0.1700, broadly steady at press time on Monday, attempting a recovery after a 2% loss the previous day. Sunday’s decline aligned with nearly 49 million PI tokens offloaded by the Pi Foundation, implying a spike in supply pressure that capped the prevailing four-day recovery.