|

GBP/USD softens towards 1.2700 ahead of Tuesday’s UKJ labor figures, BoE Gov Bailey testimony

  • GBP/USD slips back once again on Monday, dips into 1.2715.
  • UK labor figures due on Tuesday.
  • BoE Governor Bailey to testify on state of economy before UK Parliament.

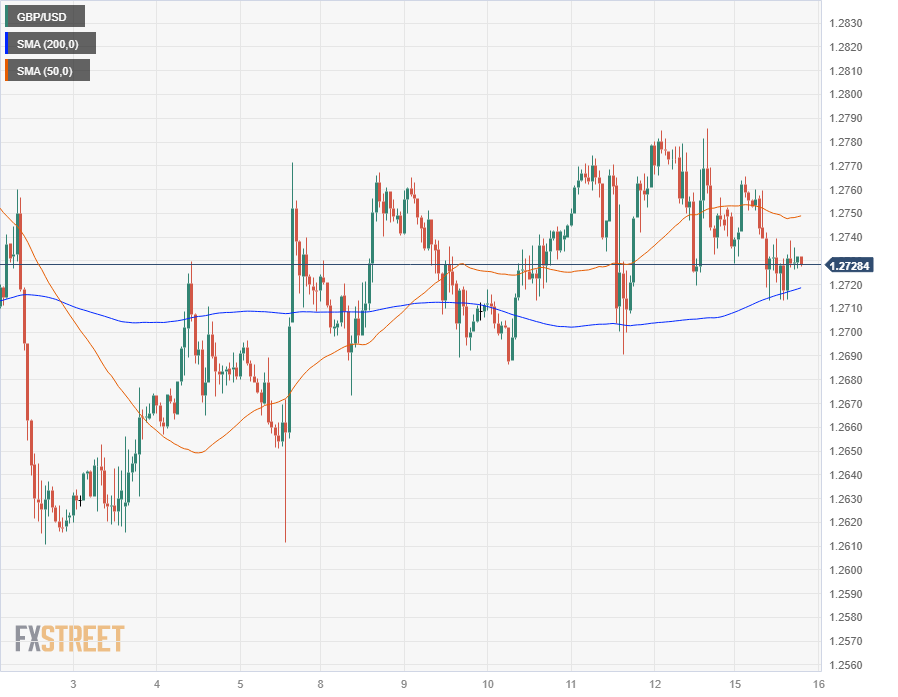
The GBP/USD fell back once more on Monday, testing 1.2715 after a short-lived rally at the Modnay open reversed course. The Pound Sterling (GBP) couldn’t get over 1.2765 against the US Dollar (USD), sliding 0.4% peak-to-trough before consolidating in holiday-thinned market volumes during the US extended weekend in observance of Martin Luther King Day.

The UK’s Rightmove House Price Index rose 1.3% in January, compared to December’s -1.9%, while the annualized figure declined 0.7%, rebounding slightly from the previous period’s -1.1%. The MoM is a firm rebound in the headline figure, but still well below last May’s near-term peak of 1.8%.

Up next will be Tuesday’s UK Claimant Count Change, ILO Unemployment Rate, and Average Earnings for the annualized quarter ended in November.

December’s Claimant Count Change printed at 16K, while the ILO quarterly Unemployment Rate is forecast to hold steady at 4.2%. UK Average Earnings growth is expected to decline both with and without bonuses factored in, with Average Earnings Excluding Bonuses for the quarter through November expected to tick back from 7.3% to 6.6%.

Bank of England (BoE) Governor Andrew Bailey will be testifying before the Lords’ Economic Affairs Committee in London before departing to attend the World Economic Forum in Davos, Switzerland.

GBP/USD Technical Outlook

The GBP/USD is caught in a near-term sideways grind, with intraday prices getting caught up on the 200-hour Simple Moving Average (SMA) near 1.2720, while 1.2780 is proving to be a tricky technical ceiling for the pair to overcome.

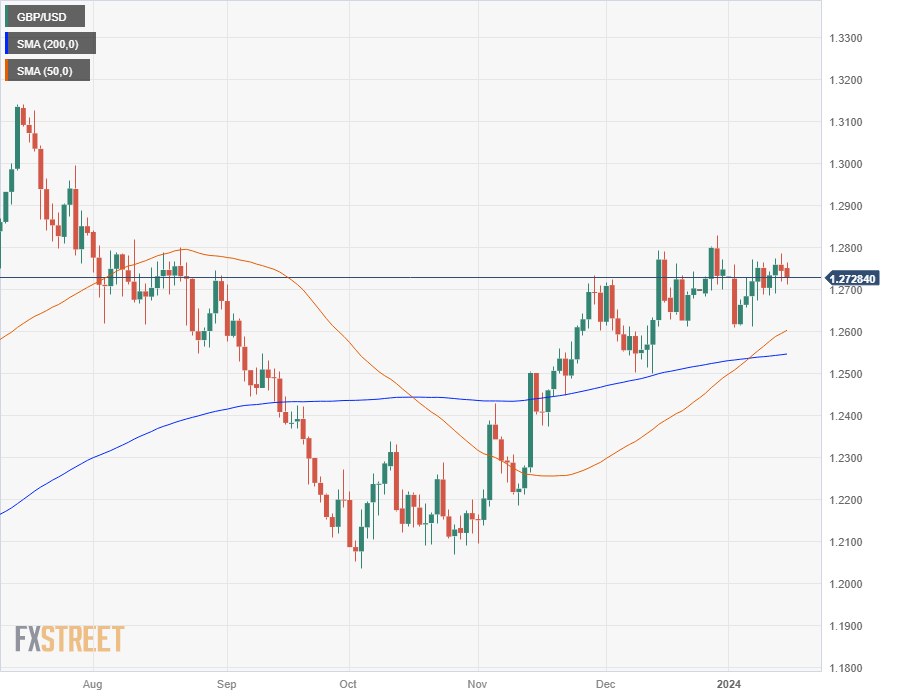
Despite the pair stuck on the low side of the 1.2800 handle near December’s peak, the pair remains on the high end of momentum on daily candles, with the pair up 5.75% from October’s swing low of 1.2037.

GBP/USD Hourly Chart
GBP/USD Daily Chart
GBP/USD Technical Levels

GBP/USD

Overview
Today last price1.2729
Today Daily Change-0.0016
Today Daily Change %-0.13
Today daily open1.2745
 
Trends
Daily SMA201.271
Daily SMA501.2596
Daily SMA1001.2451
Daily SMA2001.2545
 
Levels
Previous Daily High1.2786
Previous Daily Low1.272
Previous Weekly High1.2786
Previous Weekly Low1.2674
Previous Monthly High1.2828
Previous Monthly Low1.2501
Daily Fibonacci 38.2%1.2745
Daily Fibonacci 61.8%1.2761
Daily Pivot Point S11.2714
Daily Pivot Point S21.2684
Daily Pivot Point S31.2648
Daily Pivot Point R11.2781
Daily Pivot Point R21.2816
Daily Pivot Point R31.2847

Author

Joshua Gibson

Joshua joins the FXStreet team as an Economics and Finance double major from Vancouver Island University with twelve years' experience as an independent trader focusing on technical analysis.


More from Joshua Gibson
Share:

Editor's Picks

AUD/USD: The 0.7000 level holds the downside…for now

AUD/USD has clinched its fourth consecutive daily pullback on Thursday, coming closer to the key 0.7000 region while breaking below the critical 200-day SMA at the same time. The Aussie’s decline comes on the back of further gains in the Greenback in a context of rising yields and Fed rate hike bets.

USD/JPY keeps the red near 158.00 as Japanese Yen firms up

USD/JPY retreats from three-week highs and holds losses near 158.00 in the Asian session on Thursday. Surging Japanese bond yields lift the Yen amid looming intervention risks, while the US Dollar preserves overnight gains to a two-month high amid hawkish Fed bets and elevated US bond yields.

Gold bounces off lows, still below $4,300

Gold builds on Wednesday’s retracement, briefly slipping back below $4,250 per troy ounce to attempt a lacklustre rebound afterwards. The better tone in the US Dollar, rising US Treasury yields and expectation of extra rate hikes by the Fed continue to weigh on the precious metal in the latter part of Thursday’s NA session.

XRP is flashing three bullish signals heading into a historically weak October
XRP (XRP) is still flashing 3 bullish signals across its holders, derivatives, and ETF data. These signals come as the token gave back part of its September gains on Thursday. The token traded near $1.50 at press time, down about 6.3% over 24 hours, according to BeInCrypto Markets data. The pullback still leaves XRP up over 15.6% on the week, a gain that tracks a broader market rally.
Advanced economies: From one example of resilience to another
History tends to repeat itself in advanced economies. Once again, growth ultimately fell short of expectations by only a small margin in the first half of 2026, despite the conflict in Iran. As early as 2025, the impact of tariffs was less severe than feared.
BoJ Recap: Not as hawkish as expected

The Bank of Japan (BoJ) raised its short-term interest-rate target to 1.25% from 1.00% in a 7-2 vote, marking another step in the normalisation of monetary policy and widely matching what everyone has been expecting for weeks.