GBP/USD Price Forecast: Tumbles to two-month low below 1.3000 on soft UK CPI
- GBP/USD drops 0.34%, reaching a low of 1.2981 after soft UK inflation report shocks markets.
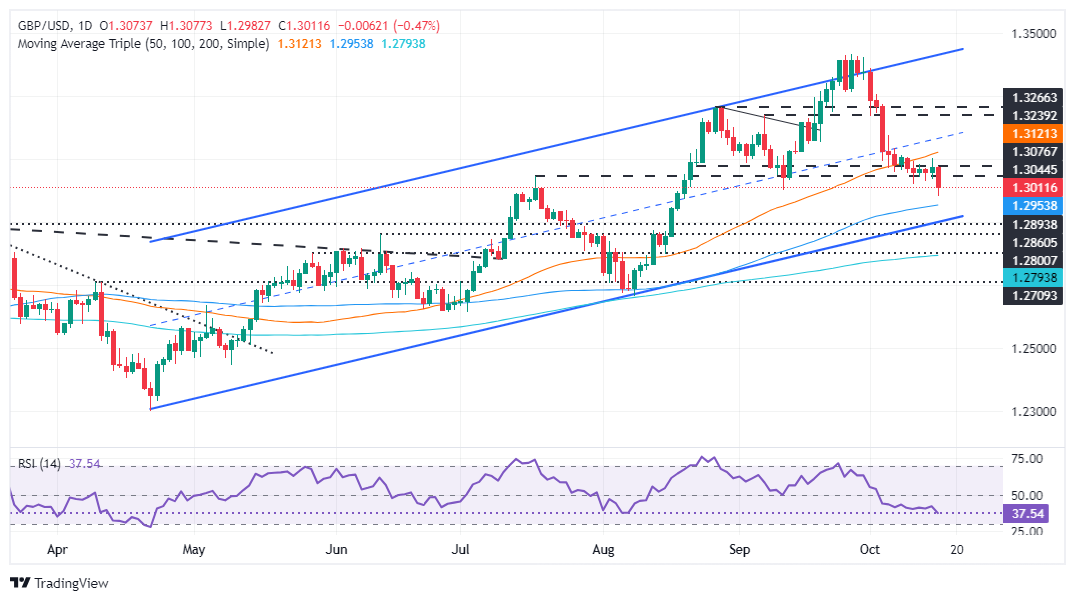
- A close below 1.3000 could lead the pair to test the 100-DMA at 1.2951 and further support levels.
- If bulls regain control, resistance at 1.3100 and the 50-DMA at 1.3118 are key upside targets.

The Pound Sterling dived following a softer-than-expected UK inflation report, which dragged the GBP/USD exchange rate to a two-month low of 1.2981. Although it has recovered some ground, the pair is losing 0.49% and trades at 1.3008 at the time of writing.
GBP/USD Price Forecast: Technical outlook
After clearing the October 14 swing low of 1.3029, the GBP/USD accelerated its fall beneath 1.3000, which could pave the way for further downside.
Momentum supports sellers, as depicted by the Relative Strength Index (RSI), which broke the last trough, indicating the downtrend is accelerating.
If GBP/USD achieves a daily close below 1.3000, this could potentially send the pair to challenge the 100-day moving average (DMA) at 1.2951. On further weakness, the next stop would be the March 8 high turned support at 1.2894. If surpassed, the pair might extend its losses to the 200-DMA at 1.2793.
However, if buyers push the exchange rate past today’s high at 1.3076, and a move to 1.3100 is on the cards. Once cleared, the 50-DMA would be the next resistance level at 1.3118.
GBP/USD Price – Daily Chart
British Pound PRICE Today
The table below shows the percentage change of British Pound (GBP) against listed major currencies today. British Pound was the strongest against the Australian Dollar.
| USD | EUR | GBP | JPY | CAD | AUD | NZD | CHF | |
|---|---|---|---|---|---|---|---|---|
| USD | 0.13% | 0.50% | 0.31% | 0.02% | 0.57% | 0.34% | 0.29% | |
| EUR | -0.13% | 0.39% | 0.20% | -0.08% | 0.45% | 0.24% | 0.10% | |
| GBP | -0.50% | -0.39% | -0.21% | -0.47% | 0.06% | -0.15% | -0.23% | |
| JPY | -0.31% | -0.20% | 0.21% | -0.25% | 0.28% | 0.05% | 0.01% | |
| CAD | -0.02% | 0.08% | 0.47% | 0.25% | 0.53% | 0.31% | 0.24% | |
| AUD | -0.57% | -0.45% | -0.06% | -0.28% | -0.53% | -0.21% | -0.28% | |
| NZD | -0.34% | -0.24% | 0.15% | -0.05% | -0.31% | 0.21% | -0.08% | |
| CHF | -0.29% | -0.10% | 0.23% | -0.01% | -0.24% | 0.28% | 0.08% |
The heat map shows percentage changes of major currencies against each other. The base currency is picked from the left column, while the quote currency is picked from the top row. For example, if you pick the British Pound from the left column and move along the horizontal line to the US Dollar, the percentage change displayed in the box will represent GBP (base)/USD (quote).
Author

Christian Borjon Valencia
FXStreet
Markets analyst, news editor, and trading instructor with over 14 years of experience across FX, commodities, US equity indices, and global macro markets.


