GBP/USD Price Forecast: Treads water above 1.3550, nine-day EMA
- GBP/USD may test the 1.3632, the fresh highest since February 2022.
- The 14-day Relative Strength Index remains above 50, suggesting that bullish bias is active.
- The primary support appears at the nine-day EMA of 1.3552.

The GBP/USD pair has recovered its daily losses, trading around 1.3570 during the Asian hours on Monday. The bullish bias may weaken as the daily chart’s technical analysis indicates that the pair is hovering around the ascending channel pattern.
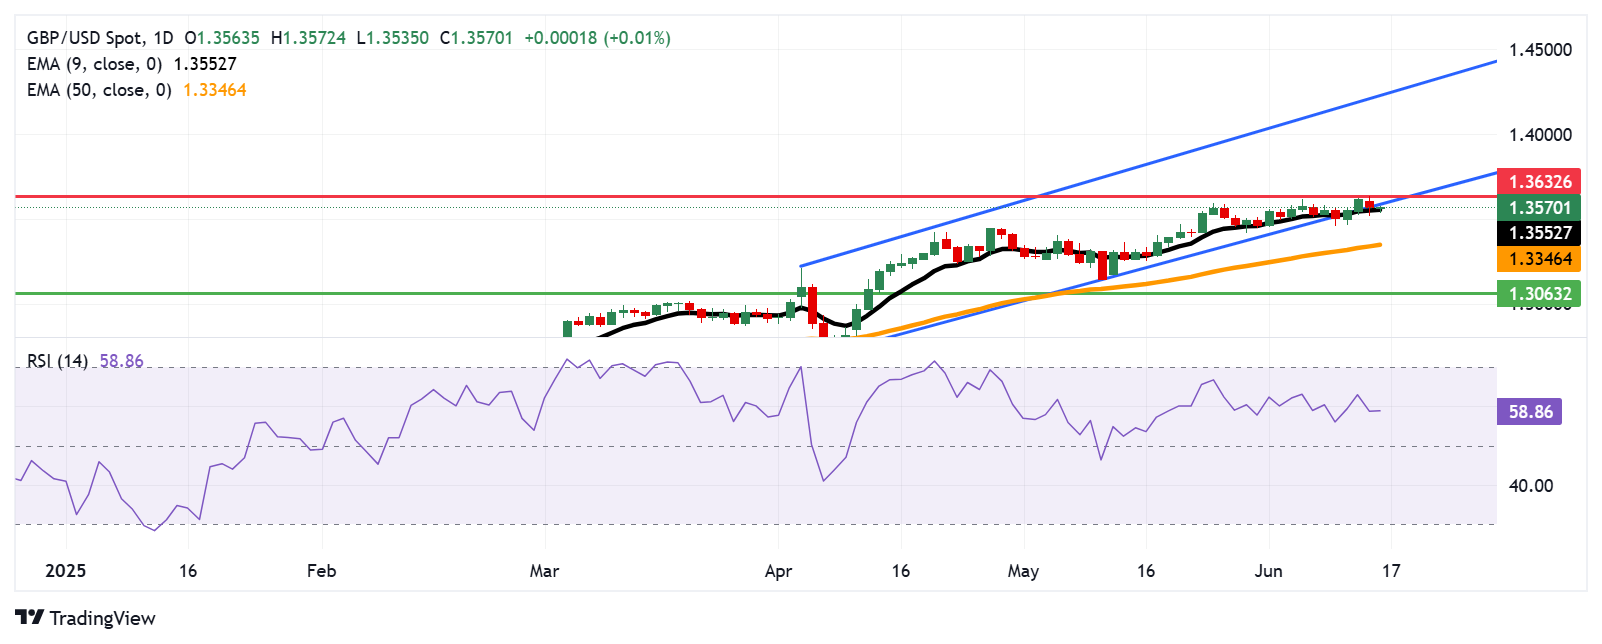
The GBP/USD pair has rebounded above the nine-day Exponential Moving Average (EMA), suggesting the short-term price momentum is still stronger. Additionally, the 14-day Relative Strength Index (RSI) is positioned above 50, indicating a bullish bias is in play.
The successful recovery of the GBP/USD pair within the ascending channel may reinforce the bullish bias and lead the pair to test the resistance at 1.3632, which was reached on June 13, the new highest since February 2022. A break above this level could prompt the pair to explore the region around the upper boundary of the ascending channel at 1.4250.
On the downside, the GBP/USD pair may find the primary support at the nine-day EMA of 1.3552, followed by the 50-day EMA at 1.3346. A break below these level could weaken the short- and medium-term price momentum and drive the pair to test the 10-week low at 1.3063, recorded on April 14.
GBP/USD: Daily Chart
British Pound PRICE Today
The table below shows the percentage change of British Pound (GBP) against listed major currencies today. British Pound was the strongest against the Canadian Dollar.
| USD | EUR | GBP | JPY | CAD | AUD | NZD | CHF | |
|---|---|---|---|---|---|---|---|---|
| USD | -0.18% | -0.07% | -0.36% | -0.06% | -0.24% | -0.18% | -0.10% | |
| EUR | 0.18% | 0.00% | -0.18% | 0.14% | 0.07% | 0.02% | 0.09% | |
| GBP | 0.07% | -0.00% | -0.18% | 0.14% | 0.07% | 0.01% | 0.09% | |
| JPY | 0.36% | 0.18% | 0.18% | 0.31% | -0.18% | -0.18% | -0.15% | |
| CAD | 0.06% | -0.14% | -0.14% | -0.31% | -0.12% | -0.13% | -0.05% | |
| AUD | 0.24% | -0.07% | -0.07% | 0.18% | 0.12% | -0.06% | 0.03% | |
| NZD | 0.18% | -0.02% | -0.01% | 0.18% | 0.13% | 0.06% | 0.08% | |
| CHF | 0.10% | -0.09% | -0.09% | 0.15% | 0.05% | -0.03% | -0.08% |
The heat map shows percentage changes of major currencies against each other. The base currency is picked from the left column, while the quote currency is picked from the top row. For example, if you pick the British Pound from the left column and move along the horizontal line to the US Dollar, the percentage change displayed in the box will represent GBP (base)/USD (quote).
Author

Akhtar Faruqui
FXStreet
Akhtar Faruqui is a Forex Analyst based in New Delhi, India. With a keen eye for market trends and a passion for dissecting complex financial dynamics, he is dedicated to delivering accurate and insightful Forex news and analysis.


