- GBP/USD tests its seven-month low at 1.2487.
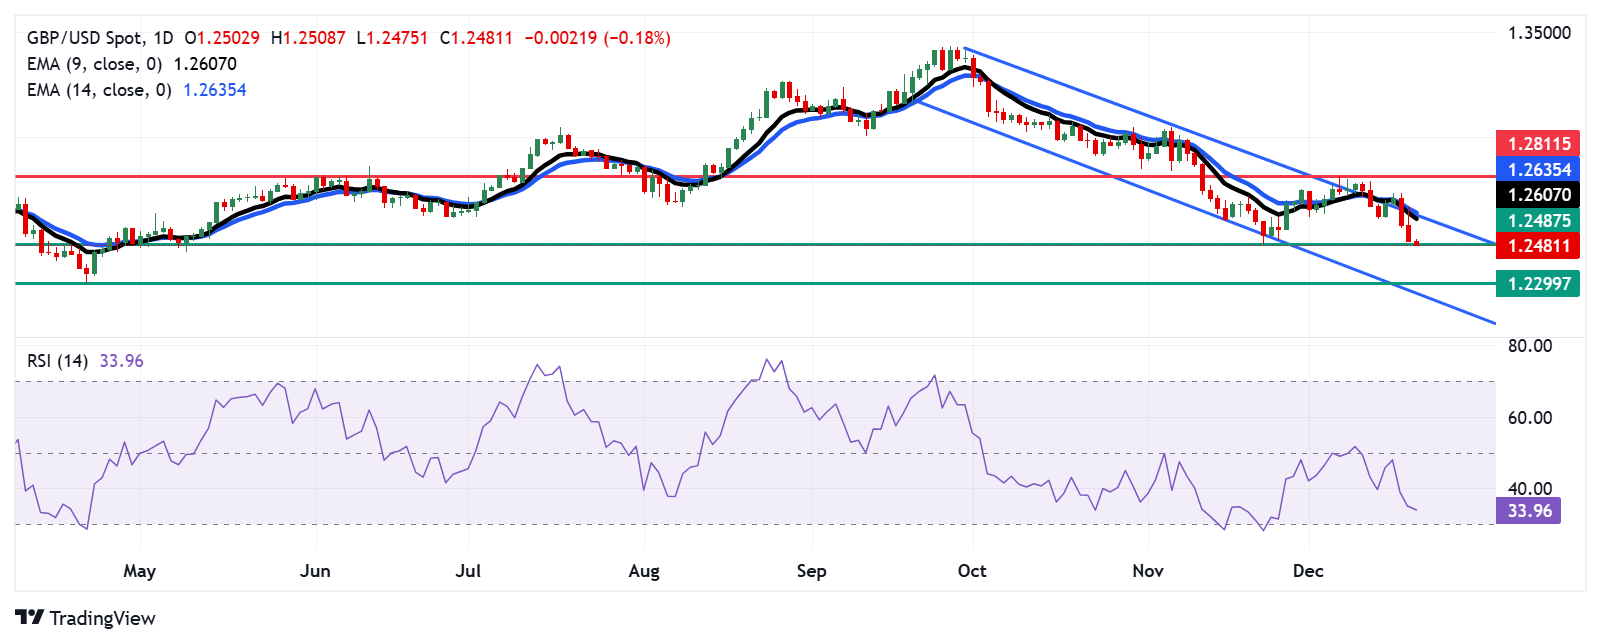
- An upward correction would be indicated once the 14-day RSI breaks below the 30 mark.
- The primary resistance zone appears around its nine-day EMA at 1.2606, followed by the descending channel's upper boundary.
GBP/USD continues to lose ground for the third consecutive day, trading around 1.2490 during the Asian hours on Friday. The daily chart analysis suggests an ongoing bearish bias as the pair is confined within the descending channel pattern.
However, the 14-day Relative Strength Index (RSI) falls to near the 30 level, suggesting a strengthening of a bearish bias. A decisive break below the 30 mark would indicate an oversold situation and a potential for an upward correction soon.
On the downside, the GBP/USD pair hovers around its seven-month low at 1.2487, recorded on November 22. A successful break below this level could amplify bearish momentum, potentially driving the pair toward its yearly low at 1.2299, last seen on April 22, followed by the lower boundary of the descending channel 1.2260 level.
Regarding resistance, the GBP/USD pair may revisit its nine-day Exponential Moving Average (EMA) at 1.2606, followed by the 14-day EMA at 1.2635, aligned with the descending channel's upper boundary. A successful break above this critical region could weaken the bearish bias, paving the way for a move toward the five-week high of 1.2811, marked on December 6.
GBP/USD: Daily Chart
British Pound PRICE Today
The table below shows the percentage change of British Pound (GBP) against listed major currencies today. British Pound was the weakest against the Japanese Yen.
USD | EUR | GBP | JPY | CAD | AUD | NZD | CHF | |
---|---|---|---|---|---|---|---|---|
USD | 0.09% | 0.16% | -0.03% | 0.21% | 0.26% | 0.21% | 0.00% | |
EUR | -0.09% | 0.07% | -0.10% | 0.13% | 0.17% | 0.11% | -0.09% | |
GBP | -0.16% | -0.07% | -0.18% | 0.05% | 0.08% | 0.04% | -0.14% | |
JPY | 0.03% | 0.10% | 0.18% | 0.24% | 0.28% | 0.20% | 0.04% | |
CAD | -0.21% | -0.13% | -0.05% | -0.24% | 0.04% | -0.01% | -0.20% | |
AUD | -0.26% | -0.17% | -0.08% | -0.28% | -0.04% | -0.07% | -0.24% | |
NZD | -0.21% | -0.11% | -0.04% | -0.20% | 0.00% | 0.07% | -0.18% | |
CHF | -0.01% | 0.09% | 0.14% | -0.04% | 0.20% | 0.24% | 0.18% |
The heat map shows percentage changes of major currencies against each other. The base currency is picked from the left column, while the quote currency is picked from the top row. For example, if you pick the British Pound from the left column and move along the horizontal line to the US Dollar, the percentage change displayed in the box will represent GBP (base)/USD (quote).
Information on these pages contains forward-looking statements that involve risks and uncertainties. Markets and instruments profiled on this page are for informational purposes only and should not in any way come across as a recommendation to buy or sell in these assets. You should do your own thorough research before making any investment decisions. FXStreet does not in any way guarantee that this information is free from mistakes, errors, or material misstatements. It also does not guarantee that this information is of a timely nature. Investing in Open Markets involves a great deal of risk, including the loss of all or a portion of your investment, as well as emotional distress. All risks, losses and costs associated with investing, including total loss of principal, are your responsibility. The views and opinions expressed in this article are those of the authors and do not necessarily reflect the official policy or position of FXStreet nor its advertisers. The author will not be held responsible for information that is found at the end of links posted on this page.
If not otherwise explicitly mentioned in the body of the article, at the time of writing, the author has no position in any stock mentioned in this article and no business relationship with any company mentioned. The author has not received compensation for writing this article, other than from FXStreet.
FXStreet and the author do not provide personalized recommendations. The author makes no representations as to the accuracy, completeness, or suitability of this information. FXStreet and the author will not be liable for any errors, omissions or any losses, injuries or damages arising from this information and its display or use. Errors and omissions excepted.
The author and FXStreet are not registered investment advisors and nothing in this article is intended to be investment advice.
Recommended content
Editors’ Picks

EUR/USD tests daily lows near 1.0350 on NFP
The buying bias in the Greenback gathers extra pace on Friday after the US economy created fewer jobs than initially estimated in January, dragging EUR/USD to the area of new lows near 1.0350.

GBP/USD flirts with daily lows near 1.2420, Dollar picks up pace
The continuation of the rebound in the US Dollar motivates GBP/USD to accelerates its losses and revisit the 1.2420 area, or daily lows, following the release of US NFP in January.

Gold tests fresh lows near $2,860 after NFP
Gold prices trim their early advance on Friday, deflating to the vicinity of the $2,860 region per ounce troy following the publication of the US labour market report in January.

Key takeaways from the January Payrolls report
The January payrolls number was weaker than expected at 143k, vs a reading of 175k. However, to counteract the downside surprise in the NFP number, the unemployment rate fell to 4% from 4.1%, and average wage data jumped by 0.5% on the month, to 4.1%, the market had been looking for a decline to 3.8%.

Top Trumps: The global economy’s House of Cards
The year has barely started and we are learning the hard way what Donald Trump’s second term in office means for markets, analysts and global policymakers. It's like living through an episode of the political thriller, House of Cards.

The Best Brokers of the Year
SPONSORED Explore top-quality choices worldwide and locally. Compare key features like spreads, leverage, and platforms. Find the right broker for your needs, whether trading CFDs, Forex pairs like EUR/USD, or commodities like Gold.