GBP/USD Price Forecast: Tests nine-day EMA barrier near 1.2950 amid a bullish bias
- GBP/USD tests immediate barrier at nine-day EMA at 1.2938 level.
- The 14-day RSI reinforces strong bullish momentum as it stays above the 50 mark.
- The primary support appears at the ascending channel’s lower boundary near 1.2840.

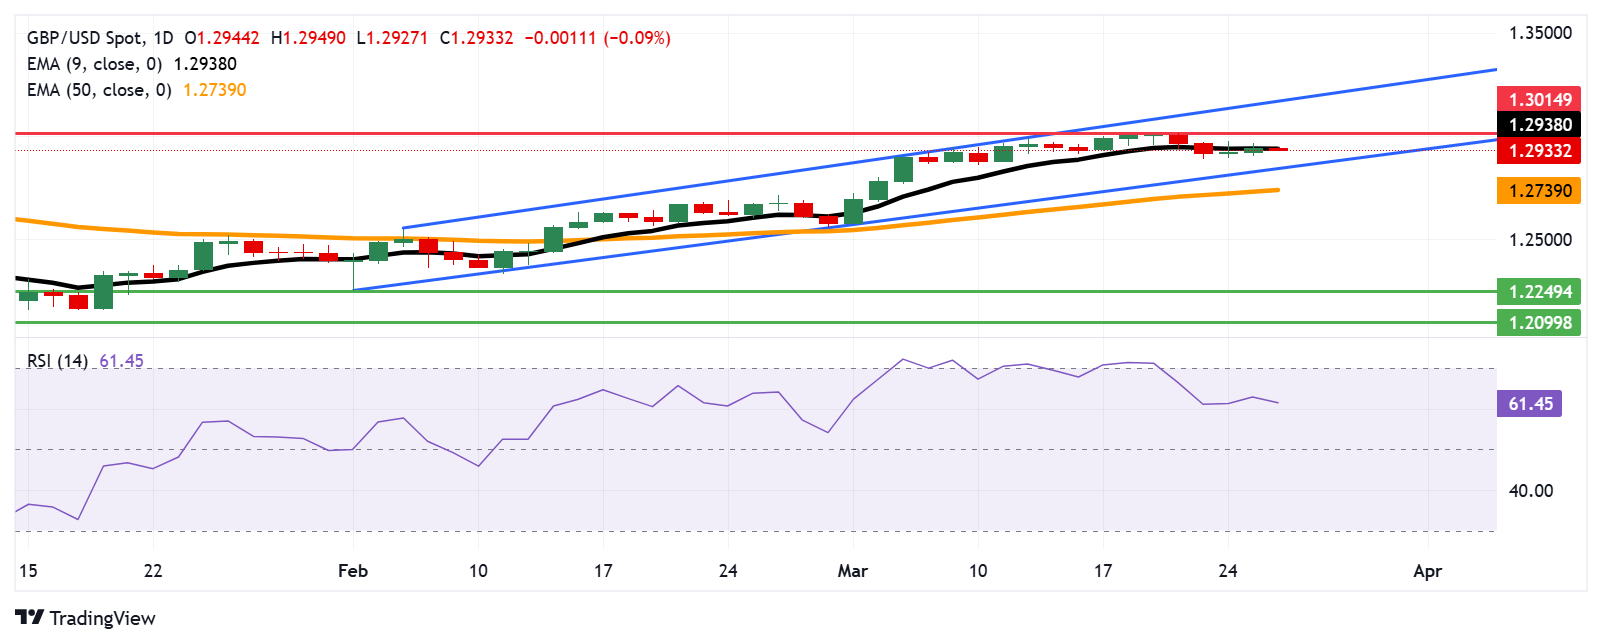
The GBP/USD pair loses ground after registering gains in the previous two sessions, trading around 1.2930 during the Asian hours on Wednesday. The technical analysis of the daily chart indicates a continued bullish bias, with the pair consolidating within an ascending channel pattern.
The 14-day Relative Strength Index (RSI) is positioned above 50, reinforcing strong bullish momentum. However, the GBP/USD pair has broken below the nine-day Exponential Moving Average (EMA), suggesting a bearish shift in the short-term price momentum.
The GBP/USD pair is testing an immediate barrier at the nine-day EMA at the 1.2938 level. A rebound above this level could revive the short-term price momentum, followed by the four-month high at 1.3014, recorded on March 20. Further advancement could reinforce the bullish bias and support the pair to test the ascending channel’s upper boundary near 1.3170.
On the downside, the GBP/USD pair is likely to navigate the region around the ascending channel’s lower boundary near 1.2840, followed by the 50-day EMA at 1.2739. A break below this level could weaken the medium-term price momentum and put downward pressure on the pair to depreciate toward a two-month low at the 1.2249 level, which was recorded on February 3.
GBP/USD: Daily Chart
British Pound PRICE Today
The table below shows the percentage change of British Pound (GBP) against listed major currencies today. British Pound was the weakest against the New Zealand Dollar.
| USD | EUR | GBP | JPY | CAD | AUD | NZD | CHF | |
|---|---|---|---|---|---|---|---|---|
| USD | 0.07% | 0.10% | 0.41% | -0.00% | -0.04% | -0.18% | 0.10% | |
| EUR | -0.07% | 0.03% | 0.31% | -0.08% | -0.10% | -0.25% | 0.03% | |
| GBP | -0.10% | -0.03% | 0.31% | -0.10% | -0.12% | -0.28% | 0.04% | |
| JPY | -0.41% | -0.31% | -0.31% | -0.40% | -0.45% | -0.58% | -0.28% | |
| CAD | 0.00% | 0.08% | 0.10% | 0.40% | 0.00% | -0.18% | 0.14% | |
| AUD | 0.04% | 0.10% | 0.12% | 0.45% | 0.00% | -0.15% | 0.16% | |
| NZD | 0.18% | 0.25% | 0.28% | 0.58% | 0.18% | 0.15% | 0.30% | |
| CHF | -0.10% | -0.03% | -0.04% | 0.28% | -0.14% | -0.16% | -0.30% |
The heat map shows percentage changes of major currencies against each other. The base currency is picked from the left column, while the quote currency is picked from the top row. For example, if you pick the British Pound from the left column and move along the horizontal line to the US Dollar, the percentage change displayed in the box will represent GBP (base)/USD (quote).
Author

Akhtar Faruqui
FXStreet
Akhtar Faruqui is a Forex Analyst based in New Delhi, India. With a keen eye for market trends and a passion for dissecting complex financial dynamics, he is dedicated to delivering accurate and insightful Forex news and analysis.


