GBP/USD Price Forecast: Rises toward 1.3100 post strong UK jobs report
- GBP/USD climbs 0.18% after strong UK jobs report shows over 373,000 jobs added, beating forecasts.
- Despite upward momentum, the pair remains within the 1.3000-1.3100 range, testing key resistance levels.
- Break above the 50-day moving average at 1.3112 could open the path to the 1.3174 October high.

The Pound Sterling recovered some ground and rose 0.18% on Tuesday against the US Dollar following a strong UK jobs report that pushed the unemployment rate lower, while the economy added over 373,000 jobs, crushing estimates of 250,000. At the time of writing, the GBP/USD trades at 1.3081 after bouncing off the daily low of 1.3035.
GBP/USD Price Forecast: Technical outlook
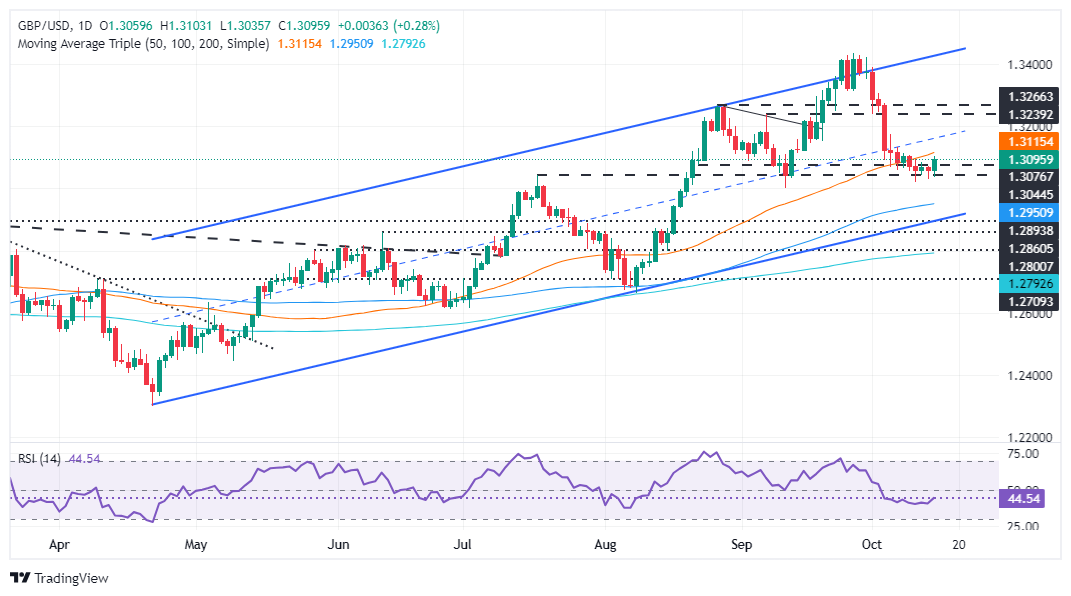
The GBP/USD remains consolidated, within the 1.3000-1.3100 range for the sixth consecutive day, even though the pair hit a high of 1.3102.
Momentum remains slightly bearish, as shown by the Relative Strength Index (RSI), but as the RSI edges toward its 50-neutral line, it could pave the way for further upside.
If GBP/USD strengthens further, the next stop would be the 50-day moving average (DMA) at 1.3112. Once surpassed, buyers could target the October 4 daily high at 1.3174, ahead of the 1.3200 figure.
On the other hand, if GBP/USD stays below 1.3100, this could expose the 1.3050 psychological level. The next support would be the October 10 swing low of 1.3010, followed by the September 11 daily low of 1.3001.
GBP/USD Price Action – Daily Chart
British Pound PRICE Today
The table below shows the percentage change of British Pound (GBP) against listed major currencies today. British Pound was the strongest against the Australian Dollar.
| USD | EUR | GBP | JPY | CAD | AUD | NZD | CHF | |
|---|---|---|---|---|---|---|---|---|
| USD | 0.05% | -0.27% | -0.36% | 0.05% | 0.15% | 0.08% | -0.17% | |
| EUR | -0.05% | -0.31% | -0.41% | -0.02% | 0.11% | 0.02% | -0.22% | |
| GBP | 0.27% | 0.31% | -0.06% | 0.31% | 0.42% | 0.34% | 0.16% | |
| JPY | 0.36% | 0.41% | 0.06% | 0.41% | 0.50% | 0.43% | 0.24% | |
| CAD | -0.05% | 0.02% | -0.31% | -0.41% | 0.10% | 0.04% | -0.14% | |
| AUD | -0.15% | -0.11% | -0.42% | -0.50% | -0.10% | -0.07% | -0.25% | |
| NZD | -0.08% | -0.02% | -0.34% | -0.43% | -0.04% | 0.07% | -0.18% | |
| CHF | 0.17% | 0.22% | -0.16% | -0.24% | 0.14% | 0.25% | 0.18% |
The heat map shows percentage changes of major currencies against each other. The base currency is picked from the left column, while the quote currency is picked from the top row. For example, if you pick the British Pound from the left column and move along the horizontal line to the US Dollar, the percentage change displayed in the box will represent GBP (base)/USD (quote).
Author

Christian Borjon Valencia
FXStreet
Markets analyst, news editor, and trading instructor with over 14 years of experience across FX, commodities, US equity indices, and global macro markets.


