GBP/USD Price Forecast: Resumes decline after facing selling pressure above 20-day EMA
- GBP/USD is down to near 1.3400 amid renewed fears of US-Iran conflicts.
- Iran’s IRGC warns against disruption near the Strait of Hormuz.
- Investors await the US PCE Inflation data for April.

The GBP/USD pair trades 0.2% lower to near 1.3400 during the European trading session on Thursday. The pair is broadly under pressure due to fears of a resumption of the Middle East war after the exchange of attacks between the United States (US) and Iran.
During the day, Iran’s Islamic Revolutionary Guard Corps (IRGC) has claimed its authority near the Strait of Hormuz, stating that Tehran is controlling and managing the passage, and any disruption will be met with a 'decisive response’. The IRGC added that vessels need to “obtain permission and coordinate with the Navy to pass through Hormuz.
Iran’s attempt to gain authority on Hormuz is in contrast with US President Donald Trump’s demands for a permanent peace deal, which includes Hormuz reopening and the handover of uranium enrichment to the US.
Meanwhile, renewed US-Iran tensions have increased the safe-haven appeal of the US Dollar. As of writing, the US Dollar Index (DXY), which tracks the Greenback’s value against six major currencies, trades higher at around 99.30.
Going forward, investors will focus on the US Personal Consumption Expenditure Price Index (PCE) data for April, which will be published at 12:30 GMT.
GBP/USD technical analysis
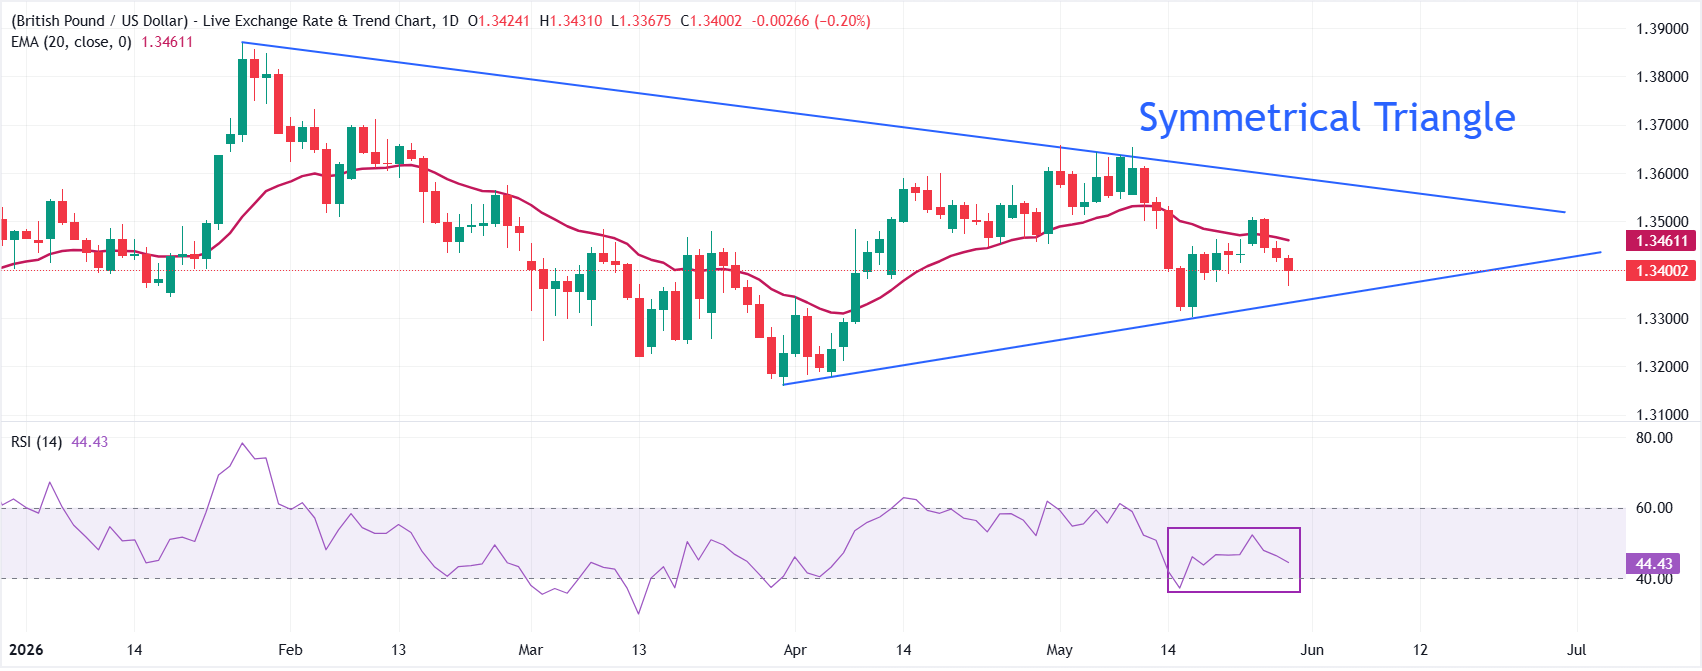
GBP/USD trades lower at around 1.3400, maintaining a near-term bearish bias as it holds beneath the 20-day Exponential Moving Average (EMA) at 1.3461 and within the broader descending trend defined by the resistance line from 1.3871 through 1.3593. The overall trend appears to be sideways amid the Symmetrical Triangle.
The Relative Strength Index (RSI) wobbles inside the 40.00-60.00 zone, reflecting indecisiveness among investors.
On the topside, initial resistance emerges at the 20-day EMA around 1.3461, with the descending trend-line region near 1.3593 acting as the next cap. On the downside, immediate support is seen near the broken uptrend reference at 1.3333, with a deeper cushion aligning with the earlier trend-line origin around 1.3162 if selling pressure accelerates.
(The technical analysis of this story was written with the help of an AI tool.)
Economic Indicator
Personal Consumption Expenditures - Price Index (YoY)
The Personal Consumption Expenditures (PCE), released by the US Bureau of Economic Analysis on a monthly basis, measures the changes in the prices of goods and services purchased by consumers in the United States (US). The YoY reading compares prices in the reference month to a year earlier. Price changes may cause consumers to switch from buying one good to another and the PCE Deflator can account for such substitutions. This makes it the preferred measure of inflation for the Federal Reserve. Generally, a high reading is bullish for the US Dollar (USD), while a low reading is bearish.
Read more.Next release: Thu May 28, 2026 12:30
Frequency: Monthly
Consensus: 3.8%
Previous: 3.5%
Source: US Bureau of Economic Analysis
Author

Sagar Dua
FXStreet
Sagar Dua is associated with the financial markets from his college days. Along with pursuing post-graduation in Commerce in 2014, he started his markets training with chart analysis.
















