GBP/USD Price Forecast: Remains above 1.2750 with testing nine-day EMA
- GBP/USD could test the immediate barrier at a nine-day EMA of 1.2767 level and the upper boundary around 1.2800 level.
- The technical analysis of a daily chart suggests a bearish bias for the pair.
- The lower edge of the descending channel around the level of 1.2650 could act as a key support.

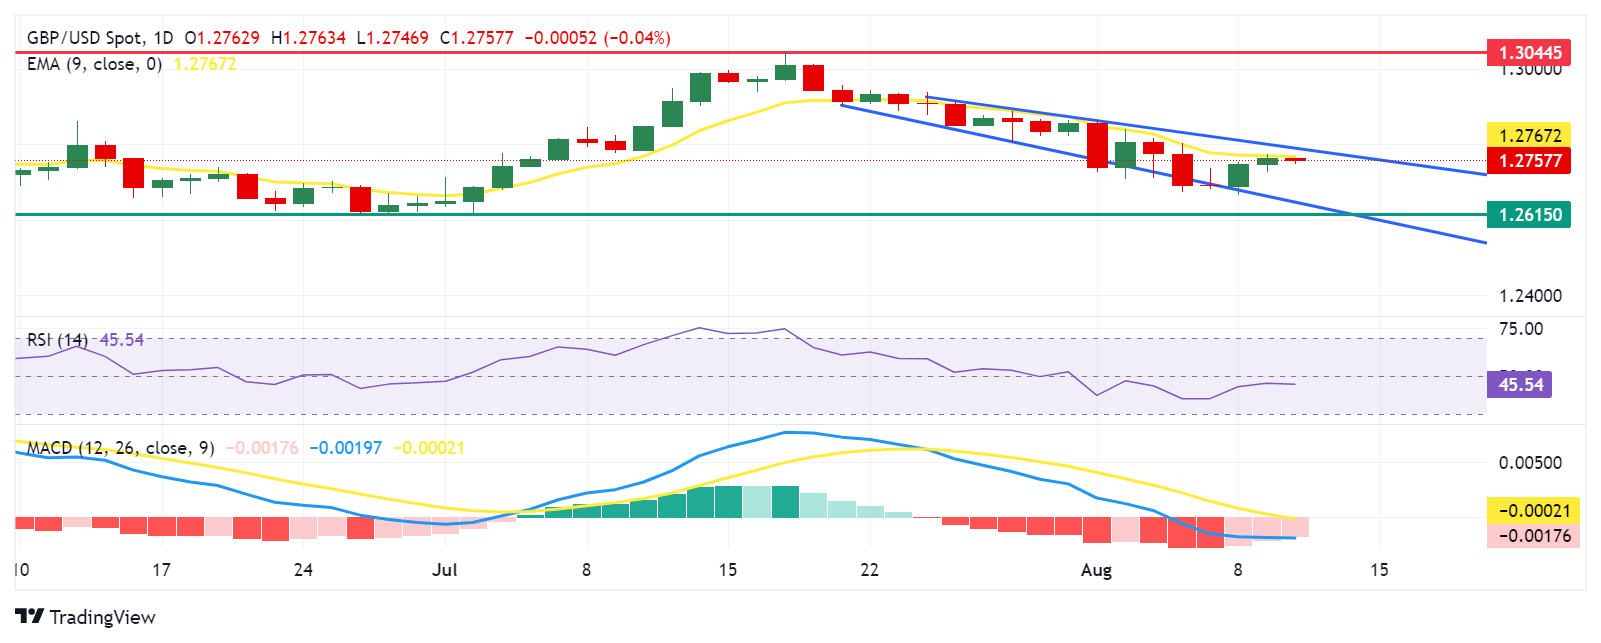
GBP/USD pauses its two-day advance, trading around 1.2760 during the Asian session on Monday. The daily chart analysis shows the pair is consolidating within a descending channel, indicating a bearish bias.
The Moving Average Convergence Divergence (MACD) indicator suggests bearish momentum, as the MACD line is below both the signal line and the centerline. Additionally, the 14-day Relative Strength Index (RSI) remains below the 50 level, reinforcing the bearish outlook.
For resistance, the pair faces an immediate barrier around the nine-day Exponential Moving Average (EMA) at the 1.2767 level, followed by the upper boundary around the 1.2800 level. A breakout above this level could propel GBP/USD toward the yearly peak of 1.3044 level, reached on July 17.
On the downside, GBP/USD may test key support at the lower edge of the descending channel around the level of 1.2650. A break below this level could increase downward pressure, potentially guiding the pair toward the throwback support at the 1.2615 level, noted in June.
GBP/USD: Daily Chart
British Pound PRICE Today
The table below shows the percentage change of British Pound (GBP) against listed major currencies today. British Pound was the weakest against the Australian Dollar.
| USD | EUR | GBP | JPY | CAD | AUD | NZD | CHF | |
|---|---|---|---|---|---|---|---|---|
| USD | -0.01% | 0.01% | 0.34% | -0.02% | -0.10% | -0.16% | 0.15% | |
| EUR | 0.00% | 0.04% | 0.32% | -0.02% | -0.22% | -0.16% | 0.17% | |
| GBP | -0.01% | -0.04% | 0.54% | -0.06% | -0.26% | -0.21% | 0.13% | |
| JPY | -0.34% | -0.32% | -0.54% | -0.34% | -0.51% | -0.50% | -0.21% | |
| CAD | 0.02% | 0.02% | 0.06% | 0.34% | -0.14% | -0.14% | 0.20% | |
| AUD | 0.10% | 0.22% | 0.26% | 0.51% | 0.14% | 0.06% | 0.39% | |
| NZD | 0.16% | 0.16% | 0.21% | 0.50% | 0.14% | -0.06% | 0.33% | |
| CHF | -0.15% | -0.17% | -0.13% | 0.21% | -0.20% | -0.39% | -0.33% |
The heat map shows percentage changes of major currencies against each other. The base currency is picked from the left column, while the quote currency is picked from the top row. For example, if you pick the British Pound from the left column and move along the horizontal line to the US Dollar, the percentage change displayed in the box will represent GBP (base)/USD (quote).
Author

Akhtar Faruqui
FXStreet
Akhtar Faruqui is a Forex Analyst based in New Delhi, India. With a keen eye for market trends and a passion for dissecting complex financial dynamics, he is dedicated to delivering accurate and insightful Forex news and analysis.