GBP/USD Price Forecast: Hovers below 1.2650, descending channel’s upper boundary
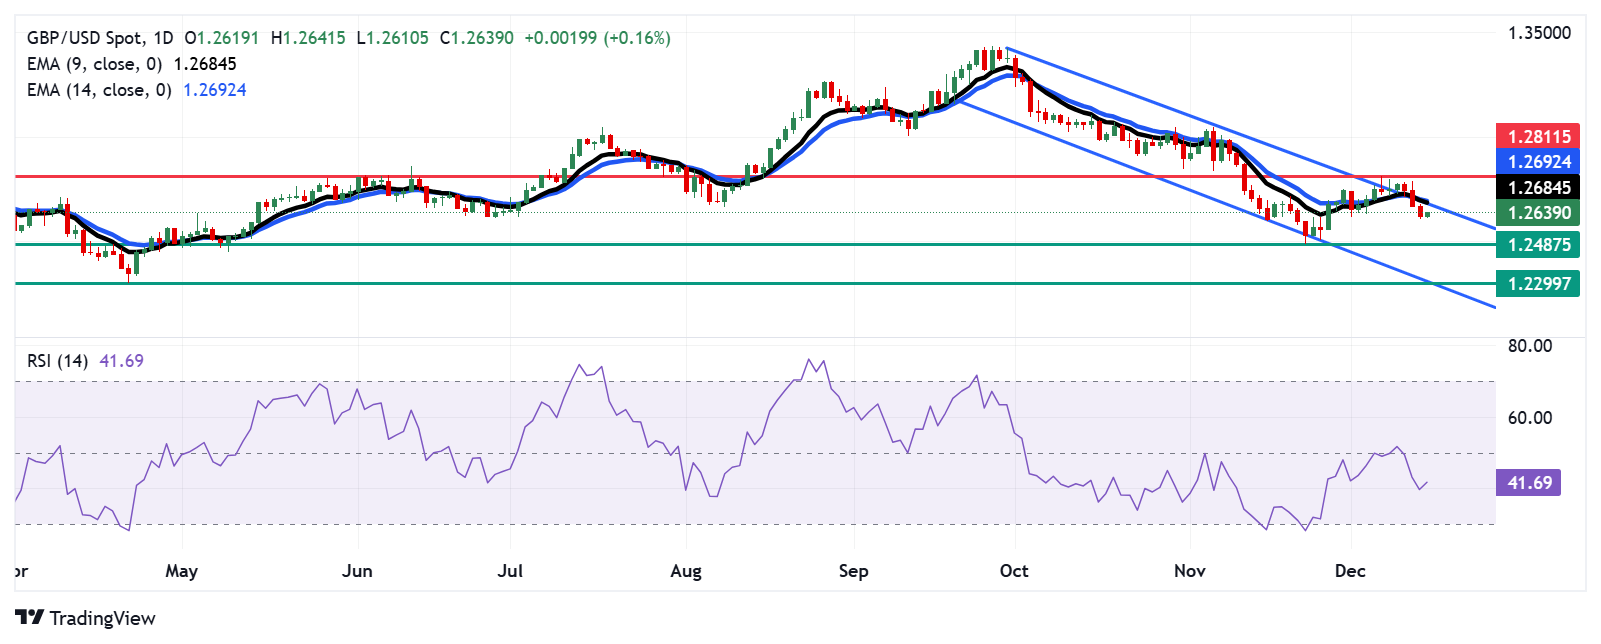
- GBP/USD remains below the descending channel’s upper boundary, aligned with the nine-day EMA at 1.2684 level.
- The bearish sentiment prevails as the 14-day RSI remains below the 50 mark.
- The primary support appears at the four-week low of 1.2487.

GBP/USD breaks its three-day losing streak, trading around 1.2640 during the early European hours on Monday. The daily chart analysis shows an ongoing bearish bias as the pair is confined within the descending channel pattern.
The 14-day Relative Strength Index (RSI) is positioned below the 50 level, strengthening the bearish sentiment. Additionally, the GBP/USD pair falls below the nine- and 14-day Exponential Moving Average (EMA), which indicates that the short-term price momentum is weaker, signaling the potential for continued price weakness.
On the downside, the GBP/USD pair may navigate the region around its four-week low of 1.2487, which was recorded on November 22. A break below this level could strengthen the bearish bias and put downward pressure on the pair to approach the lower boundary of the descending channel, aligned with its yearly low at 1.2299, reached on April 22.
The GBP/USD pair may find initial resistance around the descending channel’s upper boundary, aligned with the nine-day EMA at the 1.2684 level. A break above this level could weaken the bearish sentiment and support the pair to explore the area around its five-week high of 1.2811 level, marked on December 6.
GBP/USD: Daily Chart
British Pound PRICE Today
The table below shows the percentage change of British Pound (GBP) against listed major currencies today. British Pound was the strongest against the US Dollar.
| USD | EUR | GBP | JPY | CAD | AUD | NZD | CHF | |
|---|---|---|---|---|---|---|---|---|
| USD | -0.12% | -0.14% | -0.09% | -0.06% | -0.18% | -0.26% | -0.28% | |
| EUR | 0.12% | 0.04% | 0.13% | 0.13% | 0.12% | -0.05% | -0.10% | |
| GBP | 0.14% | -0.04% | -0.04% | 0.09% | 0.08% | -0.12% | -0.14% | |
| JPY | 0.09% | -0.13% | 0.04% | 0.02% | -0.07% | -0.14% | -0.10% | |
| CAD | 0.06% | -0.13% | -0.09% | -0.02% | -0.07% | -0.21% | -0.23% | |
| AUD | 0.18% | -0.12% | -0.08% | 0.07% | 0.07% | -0.17% | -0.22% | |
| NZD | 0.26% | 0.05% | 0.12% | 0.14% | 0.21% | 0.17% | -0.04% | |
| CHF | 0.28% | 0.10% | 0.14% | 0.10% | 0.23% | 0.22% | 0.04% |
The heat map shows percentage changes of major currencies against each other. The base currency is picked from the left column, while the quote currency is picked from the top row. For example, if you pick the British Pound from the left column and move along the horizontal line to the US Dollar, the percentage change displayed in the box will represent GBP (base)/USD (quote).
Author

Akhtar Faruqui
FXStreet
Akhtar Faruqui is a Forex Analyst based in New Delhi, India. With a keen eye for market trends and a passion for dissecting complex financial dynamics, he is dedicated to delivering accurate and insightful Forex news and analysis.