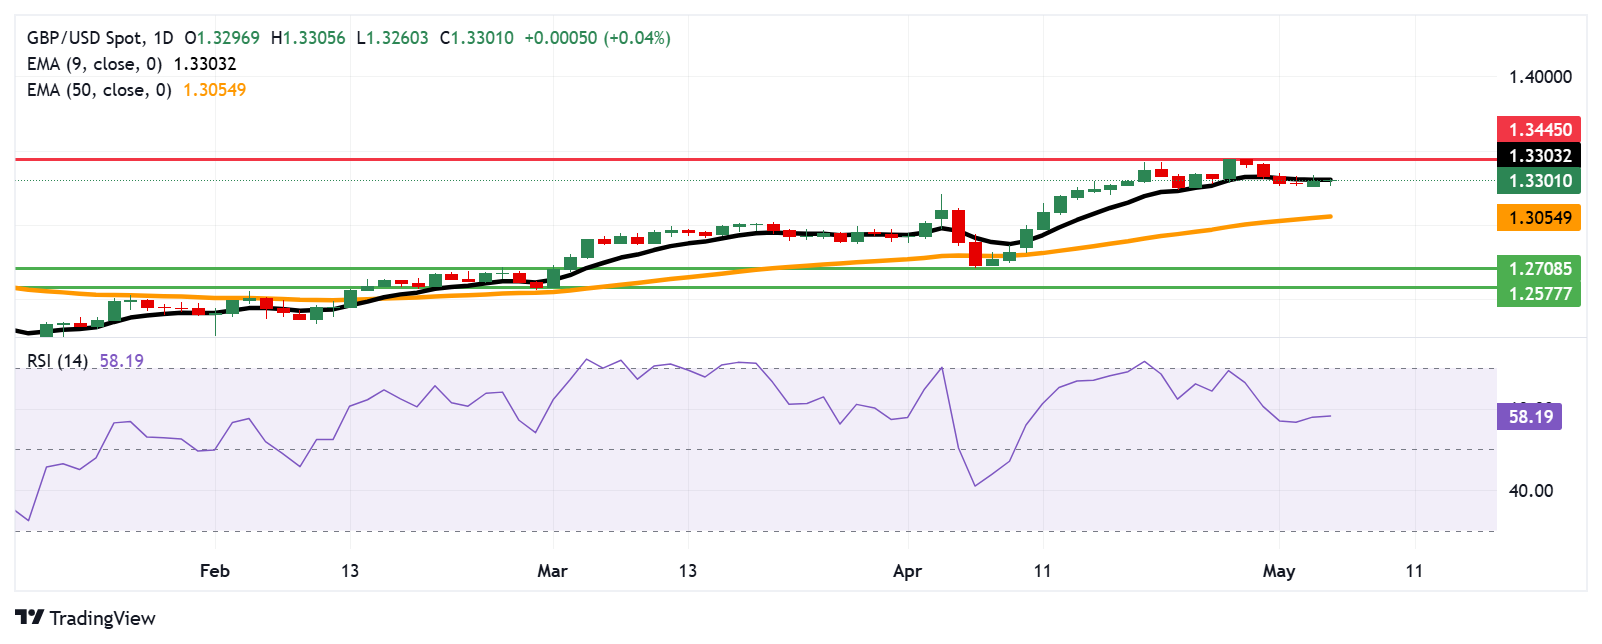
GBP/USD Price Forecast: Hovers around 1.3300 as nine-day EMA caps upside
- GBP/USD faces initial resistance at the nine-day EMA of 1.3303.
- The 14-day RSI remains above 50, suggesting a bullish bias is still in play.
- A break below the 50-day EMA of 1.3054 could weaken the medium-term price momentum.

The GBP/USD pair attempts to maintain its position after registering gains in the previous session, trading around 1.3300 during the Asian trading hours on Tuesday. Technical analysis on the daily chart suggests a neutral short-term price momentum, as the pair is hovering around the nine-day Exponential Moving Average (EMA).
However, the GBP/USD pair continues to trade above the 14-day Relative Strength Index (RSI) holds above 50, suggesting a bullish bias is still in play. Further movements will offer a clear directional trend.
The GBP/USD pair faces initial resistance at the nine-day EMA of 1.3303. A successful break above this level could improve the short-term price momentum and support the pair to test the psychological 1.3400 level, followed by 1.3445, reached on April 28 and the lowest since February 2022.
On the downside, the GBP/USD pair could find its initial support at the 50-day EMA of 1.3054. A break below this level could weaken the medium-term price momentum and put downward pressure on the pair to navigate the region around its monthly low at 1.2708, recorded on April 7. Further support appears at the two-month low of 1.2577, recorded on March 3.
GBP/USD: Daily Chart
British Pound PRICE Today
The table below shows the percentage change of British Pound (GBP) against listed major currencies today. British Pound was the strongest against the Swiss Franc.
| USD | EUR | GBP | JPY | CAD | AUD | NZD | CHF | |
|---|---|---|---|---|---|---|---|---|
| USD | -0.06% | -0.02% | 0.03% | -0.05% | 0.06% | -0.27% | 0.07% | |
| EUR | 0.06% | 0.03% | 0.10% | 0.01% | 0.11% | -0.20% | 0.13% | |
| GBP | 0.02% | -0.03% | 0.04% | -0.02% | 0.10% | -0.24% | 0.12% | |
| JPY | -0.03% | -0.10% | -0.04% | -0.08% | 0.03% | -0.21% | 0.06% | |
| CAD | 0.05% | -0.01% | 0.02% | 0.08% | 0.10% | -0.22% | 0.14% | |
| AUD | -0.06% | -0.11% | -0.10% | -0.03% | -0.10% | -0.31% | 0.04% | |
| NZD | 0.27% | 0.20% | 0.24% | 0.21% | 0.22% | 0.31% | 0.36% | |
| CHF | -0.07% | -0.13% | -0.12% | -0.06% | -0.14% | -0.04% | -0.36% |
The heat map shows percentage changes of major currencies against each other. The base currency is picked from the left column, while the quote currency is picked from the top row. For example, if you pick the British Pound from the left column and move along the horizontal line to the US Dollar, the percentage change displayed in the box will represent GBP (base)/USD (quote).
Author

Akhtar Faruqui
FXStreet
Akhtar Faruqui is a Forex Analyst based in New Delhi, India. With a keen eye for market trends and a passion for dissecting complex financial dynamics, he is dedicated to delivering accurate and insightful Forex news and analysis.


