GBP/USD Price Forecast: Finds support near 1.3300 after breaking below ascending channel
- GBP/USD may face initial resistance at the psychological level of 1.3400.
- Daily chart analysis indicates a weakening bullish trend, with the pair breaking below its ascending channel pattern.
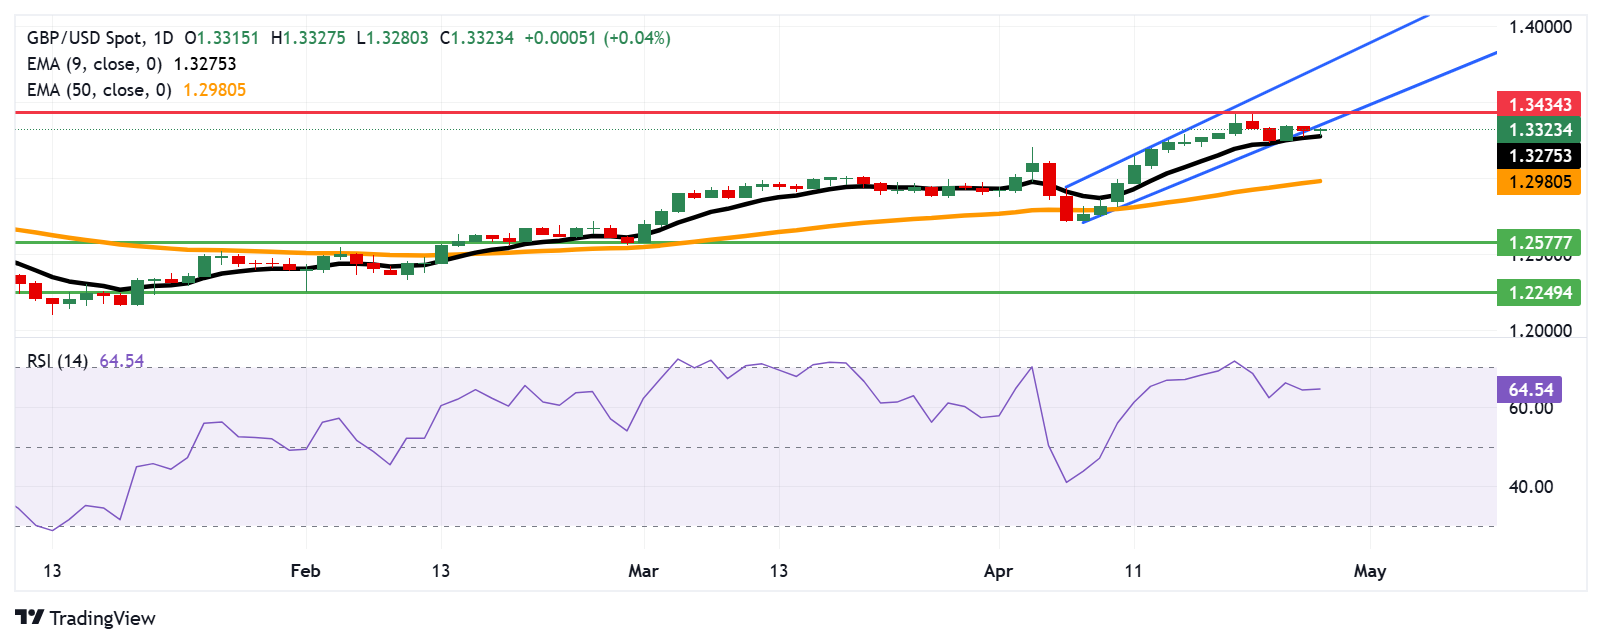
- Immediate support is seen at the nine-day EMA of 1.3274.

The GBP/USD pair steadies around 1.3320 during Asian trading hours on Monday, after posting losses in the previous session. Technical analysis on the daily chart suggests a weakening bullish trend, as the pair breaks below its ascending channel pattern.
However, the GBP/USD pair continues to trade above the nine-day Exponential Moving Average (EMA), reinforcing short-term bullish momentum. Additionally, the 14-day Relative Strength Index (RSI) holds above 50, further supporting the bullish bias.
On the upside, the GBP/USD pair faces initial resistance at the psychological 1.3400 level, followed by 1.3434 — a level last seen in September 2024 and the lowest since March 2022. A sustained break above these levels could strengthen the bullish bias, with the pair potentially aiming for the ascending channel’s upper boundary near 1.3480.
The break below the ascending channel pattern has weakened the bullish bias, putting downward pressure on the GBP/USD pair toward immediate support at the nine-day EMA of 1.3274. A decisive break below this level could undermine short-term bullish momentum, with the 50-day EMA at 1.2980 acting as the next key support.
A deeper decline beneath the 50-day EMA could damage the medium-term bullish outlook, potentially dragging the GBP/USD pair toward the two-month low of 1.2577, recorded on March 3, and further down to the three-month low of 1.2249, marked on February 3.
GBP/USD: Daily Chart
British Pound PRICE Today
The table below shows the percentage change of British Pound (GBP) against listed major currencies today. British Pound was the strongest against the Canadian Dollar.
| USD | EUR | GBP | JPY | CAD | AUD | NZD | CHF | |
|---|---|---|---|---|---|---|---|---|
| USD | -0.10% | -0.06% | -0.07% | -0.03% | -0.08% | -0.17% | -0.27% | |
| EUR | 0.10% | -0.02% | 0.02% | 0.06% | -0.07% | -0.07% | -0.19% | |
| GBP | 0.06% | 0.02% | 0.02% | 0.09% | -0.07% | -0.06% | -0.16% | |
| JPY | 0.07% | -0.02% | -0.02% | 0.07% | 0.03% | -1.50% | 0.06% | |
| CAD | 0.03% | -0.06% | -0.09% | -0.07% | -0.17% | -0.14% | -0.23% | |
| AUD | 0.08% | 0.07% | 0.07% | -0.03% | 0.17% | 0.00% | -0.11% | |
| NZD | 0.17% | 0.07% | 0.06% | 1.50% | 0.14% | -0.01% | -0.10% | |
| CHF | 0.27% | 0.19% | 0.16% | -0.06% | 0.23% | 0.11% | 0.10% |
The heat map shows percentage changes of major currencies against each other. The base currency is picked from the left column, while the quote currency is picked from the top row. For example, if you pick the British Pound from the left column and move along the horizontal line to the US Dollar, the percentage change displayed in the box will represent GBP (base)/USD (quote).
BRANDED CONTENT
Finding the right broker for your trading strategy is essential, especially when specific features make all the difference. Explore our selection of top brokers, each offering unique advantages to match your needs.
Author

Akhtar Faruqui
FXStreet
Akhtar Faruqui is a Forex Analyst based in New Delhi, India. With a keen eye for market trends and a passion for dissecting complex financial dynamics, he is dedicated to delivering accurate and insightful Forex news and analysis.


