GBP/USD Price Forecast: Falls deeper below 1.3000 on strong US Dollar
- GBP/USD turns bearish, with RSI signaling potential for further downside below 1.2900.
- Key support lies at 1.2894; a break may lead to 200-day SMA at 1.2814.
- Upside capped by 100-day SMA at 1.2990; clearing 1.3000 could target 1.3105 resistance.

The Pound Sterling dropped from around 1.2980 on Friday as the Greenback recovered some ground following Thursday’s losses. Risk aversion has seen flows into the buck; hence, the GBP/USD trades at 1.2938, down over 0.37%.
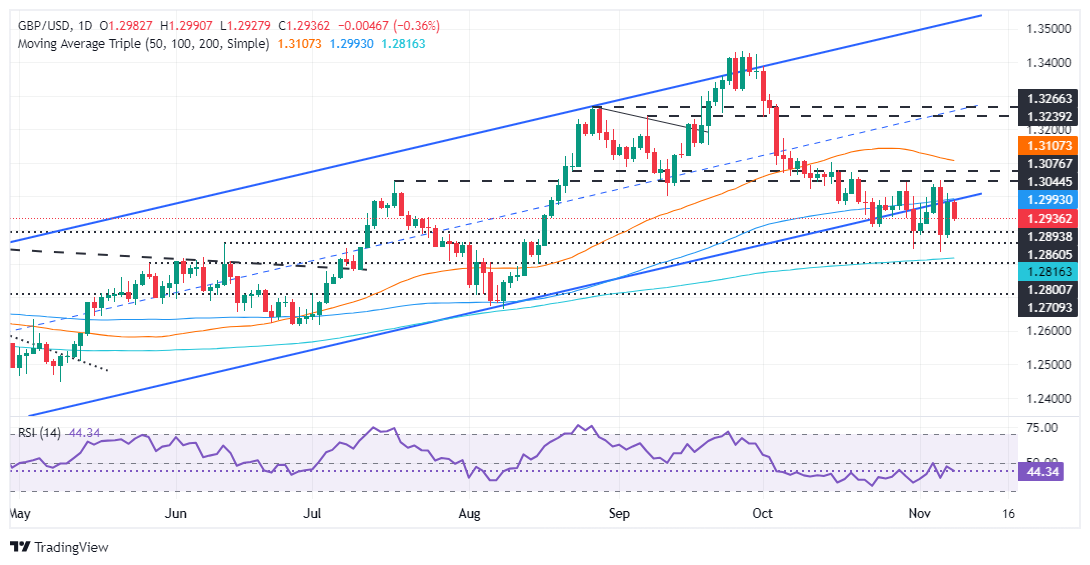
GBP/USD Price Forecast: Technical outlook
Once the GBP/USD fell below the 1.3000 figure, it turned neutral to slightly downward biased. Although the pair edged towards 1.2988 on Thursday, failure to clear the 1.30 mark exacerbated the drop toward the mid 1.2900 – 1.3000 range.
Oscillators turned bearish as seen on the Relative Strength Index (RSI). This, and price action, opened the door for further downside on the major.
The first key support would be the March 8 low of 1.2894. Once cleared, June’s 12 resistance turned support would be up next at 1.2880, ahead of dropping toward the 200-day Simple Moving Average (SMA) at 1.2814. Once surpassed up next would be the 1.2800 mark
Conversely, if buyers lift the exchange rate past the 100-day SMA at 1.2990, they could challenge 1.3000. If surpassed, the next stop would be the confluence of the October 15 high and the 50-DMA at 1.3105.
GBP/USD Price Chart – Daily
British Pound PRICE Today
The table below shows the percentage change of British Pound (GBP) against listed major currencies today. British Pound was the strongest against the Australian Dollar.
| USD | EUR | GBP | JPY | CAD | AUD | NZD | CHF | |
|---|---|---|---|---|---|---|---|---|
| USD | 0.47% | 0.36% | -0.11% | 0.27% | 1.00% | 0.66% | 0.24% | |
| EUR | -0.47% | -0.11% | -0.54% | -0.20% | 0.53% | 0.20% | -0.24% | |
| GBP | -0.36% | 0.11% | -0.43% | -0.09% | 0.65% | 0.30% | -0.13% | |
| JPY | 0.11% | 0.54% | 0.43% | 0.38% | 1.10% | 0.76% | 0.33% | |
| CAD | -0.27% | 0.20% | 0.09% | -0.38% | 0.72% | 0.39% | -0.03% | |
| AUD | -1.00% | -0.53% | -0.65% | -1.10% | -0.72% | -0.34% | -0.77% | |
| NZD | -0.66% | -0.20% | -0.30% | -0.76% | -0.39% | 0.34% | -0.43% | |
| CHF | -0.24% | 0.24% | 0.13% | -0.33% | 0.03% | 0.77% | 0.43% |
The heat map shows percentage changes of major currencies against each other. The base currency is picked from the left column, while the quote currency is picked from the top row. For example, if you pick the British Pound from the left column and move along the horizontal line to the US Dollar, the percentage change displayed in the box will represent GBP (base)/USD (quote).
Author

Christian Borjon Valencia
FXStreet
Markets analyst, news editor, and trading instructor with over 14 years of experience across FX, commodities, US equity indices, and global macro markets.


