GBP/USD Price Forecast: Falls below 1.3300 on risk-off mood
- GBP/USD declines by over 0.50%, on sour sentiment due to Middle East tensions.
- UK Manufacturing PMI expanded but slowed, while US ISM Manufacturing PMI improved yet remained in contractionary territory.
- A break below 1.3300 could lead to testing support at 1.3266, with further downside risk toward 1.3200 and 1.3145.

The Pound Sterling fell against the Greenback during the North American session, losing over 0.50% amid a risk-off mood due to heightened tensions in the Middle East. At the time of writing, the GBP/USD trades at 1.3300.
Business activity remains resilient, according to S&P Global, which revealed September’s Manufacturing PMI expanded as expected but slowed compared to the previous reading. Across the pond, the ISM Manufacturing PMI improved yet remained in contractionary territory.
GBP/USD Price Forecast: Technical outlook
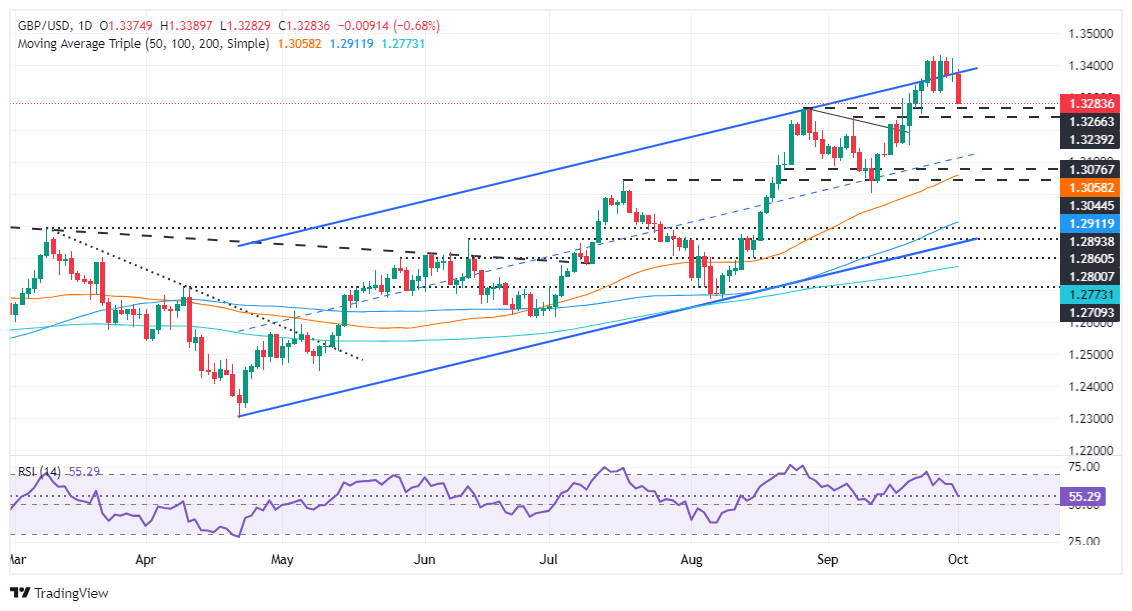
The GBP/USD extended its losses below 1.3300, opening the door for further downside. Sellers are eyeing August 27’s peak of 1.3266. In the short term, momentum shifted to be bearish, as portrayed by the Relative Strength Index (RSI), which aimed toward its neutral line. However, the RSI is still in bullish territory.
Once the GBP/USD clears the August 27 high, the next support would be the 1.3200 figure. On further weakness, the next stop would be the September 17 daily low of 1.3145, followed by the 1.3100 mark.
Conversely, for a bullish continuation, the GBP/USD must climb past 1.3300 and clear the top-trendline of the ascending channel at around 1.3380-90.
GBP/USD Price Action – Daily Chart
British Pound PRICE Today
The table below shows the percentage change of British Pound (GBP) against listed major currencies today. British Pound was the strongest against the New Zealand Dollar.
| USD | EUR | GBP | JPY | CAD | AUD | NZD | CHF | |
|---|---|---|---|---|---|---|---|---|
| USD | 0.53% | 0.67% | 0.01% | -0.16% | 0.43% | 0.96% | -0.04% | |
| EUR | -0.53% | 0.12% | -0.53% | -0.70% | -0.09% | 0.41% | -0.58% | |
| GBP | -0.67% | -0.12% | -0.65% | -0.82% | -0.22% | 0.30% | -0.69% | |
| JPY | -0.01% | 0.53% | 0.65% | -0.15% | 0.44% | 0.95% | -0.03% | |
| CAD | 0.16% | 0.70% | 0.82% | 0.15% | 0.60% | 1.13% | 0.10% | |
| AUD | -0.43% | 0.09% | 0.22% | -0.44% | -0.60% | 0.51% | -0.49% | |
| NZD | -0.96% | -0.41% | -0.30% | -0.95% | -1.13% | -0.51% | -0.98% | |
| CHF | 0.04% | 0.58% | 0.69% | 0.03% | -0.10% | 0.49% | 0.98% |
The heat map shows percentage changes of major currencies against each other. The base currency is picked from the left column, while the quote currency is picked from the top row. For example, if you pick the British Pound from the left column and move along the horizontal line to the US Dollar, the percentage change displayed in the box will represent GBP (base)/USD (quote).
Author

Christian Borjon Valencia
FXStreet
Markets analyst, news editor, and trading instructor with over 14 years of experience across FX, commodities, US equity indices, and global macro markets.


