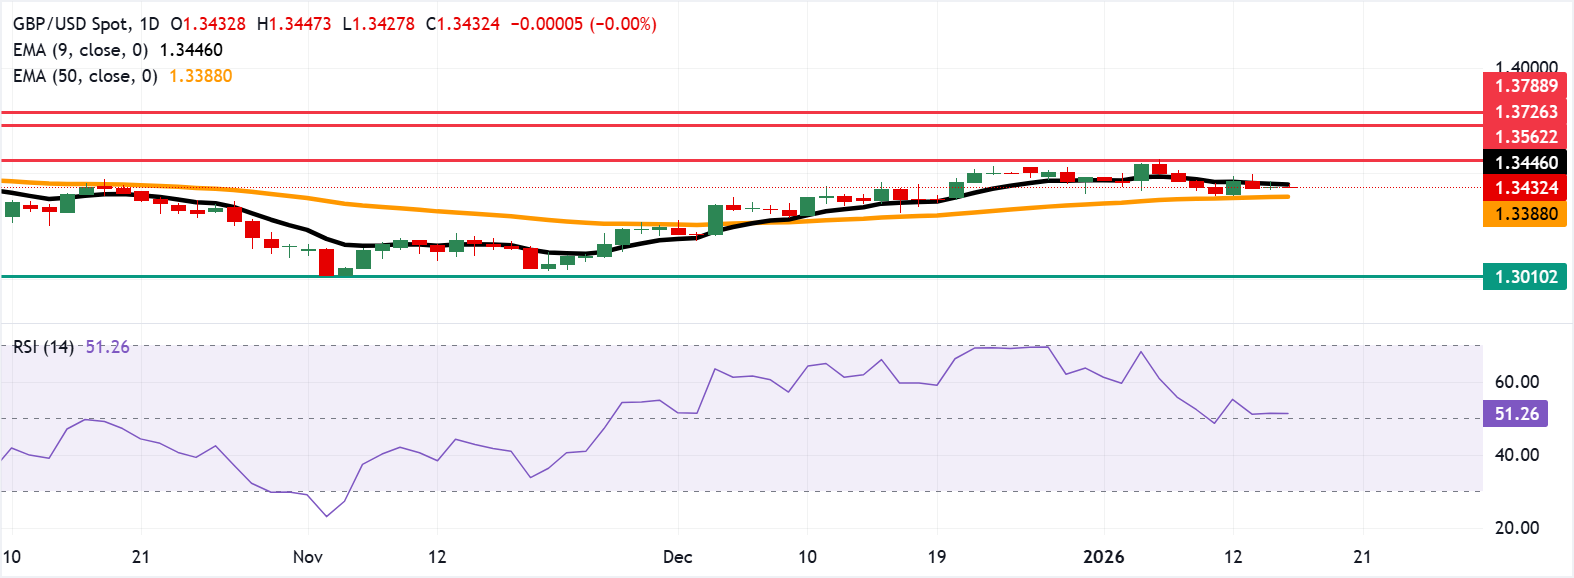
GBP/USD Price Forecast: Eyes nine-day EMA barrier near 1.3450
- GBP/USD could find the immediate resistance at the nine-day EMA of 1.3446.
- The 14-day Relative Strength Index is at 51, indicating balanced momentum.
- The primary support appears at the 50-day EMA at 1.3388.

GBP/USD remains steady for the second successive session, trading around 1.3430 during the Asian hours on Thursday. The momentum indicator 14-day Relative Strength Index (RSI) is at 51 (neutral) after retreating from overbought readings, indicating balanced momentum.
The 50-day Exponential Moving Average (EMA) edges higher, supporting the broader bias as the GBP/USD pair holds above it. The nine-day EMA slips and caps near-term recoveries, signaling a modest loss of momentum. A drop through the short-term average would tilt the bias lower toward the static floor, while holding above it would keep dips contained and favor renewed tests of overhead resistance.
The immediate resistance lies at the nine-day EMA of 1.3446. A daily close back above the short-term average could open a path toward the three-month high of 1.3562 as the next barrier. Further advances would lead the GBP/USD pair to explore the region around the six-month high of 1.3726, followed by the 1.3788, the highest level since October 2021.
The initial support lies at the 50-day EMA at 1.3388. A daily close under the medium-term average would open the doors for the GBP/USD pair to navigate the region around the eight-month low of 1.3010.
Pound Sterling Price Today
The table below shows the percentage change of British Pound (GBP) against listed major currencies today. British Pound was the weakest against the Swiss Franc.
| USD | EUR | GBP | JPY | CAD | AUD | NZD | CHF | |
|---|---|---|---|---|---|---|---|---|
| USD | 0.02% | -0.00% | -0.05% | 0.06% | 0.11% | 0.18% | -0.06% | |
| EUR | -0.02% | -0.02% | -0.07% | 0.04% | 0.09% | 0.15% | -0.08% | |
| GBP | 0.00% | 0.02% | -0.04% | 0.06% | 0.11% | 0.18% | -0.06% | |
| JPY | 0.05% | 0.07% | 0.04% | 0.09% | 0.15% | 0.19% | -0.02% | |
| CAD | -0.06% | -0.04% | -0.06% | -0.09% | 0.06% | 0.11% | -0.10% | |
| AUD | -0.11% | -0.09% | -0.11% | -0.15% | -0.06% | 0.07% | -0.17% | |
| NZD | -0.18% | -0.15% | -0.18% | -0.19% | -0.11% | -0.07% | -0.24% | |
| CHF | 0.06% | 0.08% | 0.06% | 0.02% | 0.10% | 0.17% | 0.24% |
The heat map shows percentage changes of major currencies against each other. The base currency is picked from the left column, while the quote currency is picked from the top row. For example, if you pick the British Pound from the left column and move along the horizontal line to the US Dollar, the percentage change displayed in the box will represent GBP (base)/USD (quote).
(The technical analysis of this story was written with the help of an AI tool.)
Author

Akhtar Faruqui
FXStreet
Akhtar Faruqui is a Forex Analyst based in New Delhi, India. With a keen eye for market trends and a passion for dissecting complex financial dynamics, he is dedicated to delivering accurate and insightful Forex news and analysis.


