- GBP/USD downtrend intensifies, with momentum signaling further downside as RSI nears a break below neutral.
- Key support at 1.3044 could trigger deeper losses, with the 50-DMA at 1.2933 and the 1.2900 mark as critical levels.
- Buyers must reclaim 1.3239 for a bullish continuation and to regain upward momentum.
The GBP/USD begins the North American session down by over 0.30% on Monday as traders trim the chances of a 50-basis point Fed interest rate cut in ten days. At the time of writing, the pair trades at 1.3075 after reaching a high of 1.3143.
GBP/USD Price Forecast: Technical outlook
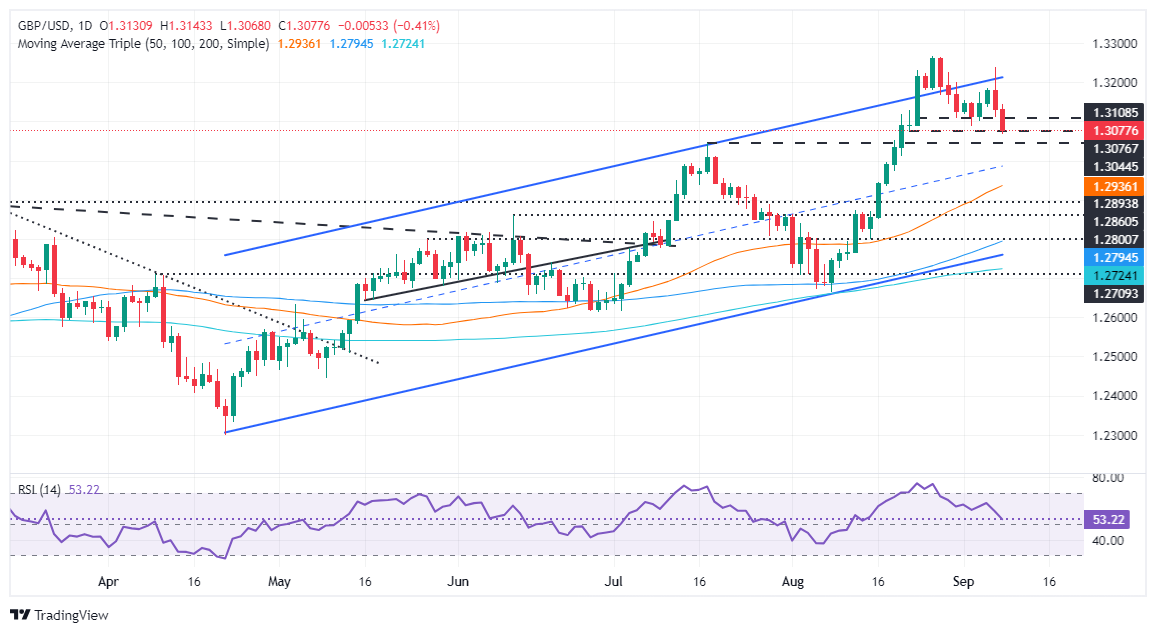
The GBP/USD has fallen below the 1.3100 mark, though the uptrend remains intact unless sellers grab the pair below the July 17 high of 1.3044, which could open the door for a deeper pullback.
Momentum suggests further downside. The Relative Strength Index (RSI) is about to punch below its neutral line, which could spark a sell-off. Therefore, in the short term, the path of least resistance is tilted to the downside.
The first support for GBP/USD would be the July 17 peak turned support, followed by the 1.3000 figure. Further losses are seen beneath that level, with the 50-day moving average (DMA) emerging as the potential line of defense for buyers at 1.2933, ahead of 1.2900.
For a bullish continuation, GBP/USD buyers must reclaim last week’s peak at 1.3239.
GBP/USD Price Action – Daily Chart
British Pound PRICE Today
The table below shows the percentage change of British Pound (GBP) against listed major currencies today. British Pound was the strongest against the New Zealand Dollar.
USD | EUR | GBP | JPY | CAD | AUD | NZD | CHF | |
---|---|---|---|---|---|---|---|---|
USD | 0.42% | 0.40% | 0.34% | -0.01% | 0.22% | 0.52% | 0.37% | |
EUR | -0.42% | -0.07% | -0.02% | -0.43% | -0.25% | 0.14% | -0.07% | |
GBP | -0.40% | 0.07% | -0.07% | -0.35% | -0.18% | 0.19% | -0.01% | |
JPY | -0.34% | 0.02% | 0.07% | -0.35% | -0.11% | 0.19% | 0.21% | |
CAD | 0.00% | 0.43% | 0.35% | 0.35% | 0.27% | 0.54% | 0.53% | |
AUD | -0.22% | 0.25% | 0.18% | 0.11% | -0.27% | 0.37% | 0.14% | |
NZD | -0.52% | -0.14% | -0.19% | -0.19% | -0.54% | -0.37% | -0.19% | |
CHF | -0.37% | 0.07% | 0.00% | -0.21% | -0.53% | -0.14% | 0.19% |
The heat map shows percentage changes of major currencies against each other. The base currency is picked from the left column, while the quote currency is picked from the top row. For example, if you pick the British Pound from the left column and move along the horizontal line to the US Dollar, the percentage change displayed in the box will represent GBP (base)/USD (quote).
Information on these pages contains forward-looking statements that involve risks and uncertainties. Markets and instruments profiled on this page are for informational purposes only and should not in any way come across as a recommendation to buy or sell in these assets. You should do your own thorough research before making any investment decisions. FXStreet does not in any way guarantee that this information is free from mistakes, errors, or material misstatements. It also does not guarantee that this information is of a timely nature. Investing in Open Markets involves a great deal of risk, including the loss of all or a portion of your investment, as well as emotional distress. All risks, losses and costs associated with investing, including total loss of principal, are your responsibility. The views and opinions expressed in this article are those of the authors and do not necessarily reflect the official policy or position of FXStreet nor its advertisers. The author will not be held responsible for information that is found at the end of links posted on this page.
If not otherwise explicitly mentioned in the body of the article, at the time of writing, the author has no position in any stock mentioned in this article and no business relationship with any company mentioned. The author has not received compensation for writing this article, other than from FXStreet.
FXStreet and the author do not provide personalized recommendations. The author makes no representations as to the accuracy, completeness, or suitability of this information. FXStreet and the author will not be liable for any errors, omissions or any losses, injuries or damages arising from this information and its display or use. Errors and omissions excepted.
The author and FXStreet are not registered investment advisors and nothing in this article is intended to be investment advice.
Recommended content
Editors’ Picks

EUR/USD strengthens above 1.1600 on risk-on mood
The EUR/USD pair edges higher to around 1.1615 during the early European session on Wednesday. The improved risk sentiment provides some support to the Euro against the Greenback. Traders will take more cues from the Federal Reserve’s Chair Jerome Powell testifies later on Wednesday.

GBP/USD holds gains above 1.3600 due to improved risk appetite
GBP/USD extends its winning streak for the third successive session, trading around 1.3620 during the Asian hours on Wednesday. The pair is hovering around 1.3648, the highest since February 2022, which was recorded on Tuesday. The risk-sensitive GBP/USD pair receives support from the improved risk appetite amid easing tensions in the Middle East.

Gold price struggles to lure buyers as easing Middle East tensions offsets weaker USD
Gold price edges higher as Fed rate cut bets keep the USD bulls on the defensive. Doubts over the durability of the Israel-Iran ceasefire also support the commodity. Traders look forward to this week’s important US macro data for a fresh impetus.

Bitcoin, Ethereum and Ripple eye key breakouts
Bitcoin price continued to trade in green on Wednesday, having risen 5% over the previous two days. Ethereum and Ripple followed BTC’s footsteps and rallied, approaching their key resistance levels, where a breakout would suggest further upside moves.

Could Iran block the Strait of Hormuz? Why Oil is on edge after US strikes
As the Israel-Iran conflict reaches new heights, an old threat is coming back to haunt the markets: that of the closure of the Strait of Hormuz. This narrow arm of the sea in the Persian Gulf, wedged between Iran to the north and the United Arab Emirates and Oman to the south, is much more than a simple sea passage.

The Best brokers to trade EUR/USD
SPONSORED Discover the top brokers for trading EUR/USD in 2025. Our list features brokers with competitive spreads, fast execution, and powerful platforms. Whether you're a beginner or an expert, find the right partner to navigate the dynamic Forex market.