- GBP/USD attracts some buying near the 200-day SMA, though lacks follow-through.
- The overnight failure near the trend-channel resistance warrants caution for bulls.
- A sustained break below the 1.2100 mark should pave the way for deeper losses.
The GBP/USD pair finds some support near the very important 200-day SMA and stalls the previous day's retracement slide from its highest level since June 17. Spot prices, however, struggle to gain any meaningful traction and seesaw between tepid gains/minor losses around the 1.2200 mark through the mid-European session.
The US Dollar struggles to capitalize on the overnight solid recovery move from over a five-month low and turns out to be a key factor lending support to the GBP/USD pair. That said, expectations that the Fed may raise interest rates more than projected act as a tailwind for the buck. This, along with a bleak outlook for the UK economy, keeps a lid on any meaningful upside for spot prices.
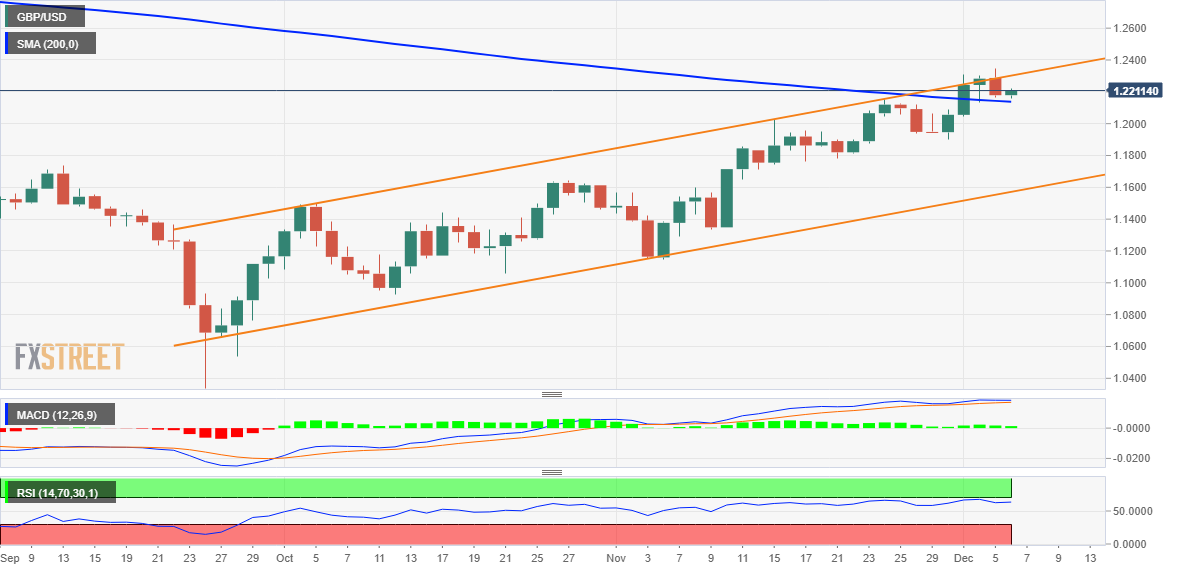
From a technical perspective, the overnight failure near a resistance marked by the top end of over a two-month-old ascending channel could be seen as the first sign of bullish exhaustion. The lack of follow-through selling, however, warrants some caution before confirming that the GBP/USD pair might have formed a near-term top and positioning for any meaningful corrective downfall.
In the meantime, the daily swing low, around the 1.2160-1.2155 area, could act as immediate support ahead of the 200 DMA, currently around the 1.2135 region. This is followed by the 1.2100 mark, which if broken decisively will make the GBP/USD pair vulnerable to weaken further to the 1.2000 psychological mark. The downward trajectory could get extended to the 1.1935-1.1930 horizontal support.
On the flip side, any meaningful intraday positive move might confront hurdle near the 1.2250-1.2255 zone, above which the GBP/USD pair could reclaim the 1.2300 mark. Some follow-through buying should allow bulls to aim back to the multi-month peak, around the 1.2345 area touched on Monday. Spot prices could eventually climb to the trend-channel barrier, currently around the 1.2400 mark.
GBP/USD daily chart
Key levels to watch
Information on these pages contains forward-looking statements that involve risks and uncertainties. Markets and instruments profiled on this page are for informational purposes only and should not in any way come across as a recommendation to buy or sell in these assets. You should do your own thorough research before making any investment decisions. FXStreet does not in any way guarantee that this information is free from mistakes, errors, or material misstatements. It also does not guarantee that this information is of a timely nature. Investing in Open Markets involves a great deal of risk, including the loss of all or a portion of your investment, as well as emotional distress. All risks, losses and costs associated with investing, including total loss of principal, are your responsibility. The views and opinions expressed in this article are those of the authors and do not necessarily reflect the official policy or position of FXStreet nor its advertisers. The author will not be held responsible for information that is found at the end of links posted on this page.
If not otherwise explicitly mentioned in the body of the article, at the time of writing, the author has no position in any stock mentioned in this article and no business relationship with any company mentioned. The author has not received compensation for writing this article, other than from FXStreet.
FXStreet and the author do not provide personalized recommendations. The author makes no representations as to the accuracy, completeness, or suitability of this information. FXStreet and the author will not be liable for any errors, omissions or any losses, injuries or damages arising from this information and its display or use. Errors and omissions excepted.
The author and FXStreet are not registered investment advisors and nothing in this article is intended to be investment advice.
Recommended content
Editors’ Picks
AUD/USD holds above 0.6500 in thin trading
The Australian Dollar managed to recover ground against its American rival after AUD/USD fell to 0.6484. The upbeat tone of Wall Street underpinned the Aussie despite broad US Dollar strength and tepid Australian data.
EUR/USD comfortable below 1.0800 lower lows at sight
The EUR/USD pair lost ground on Thursday and settled near a fresh March low of 1.0774. Strong US data and hawkish Fed speakers comments lead the way ahead of the release of the US PCE Price Index on Friday.
Gold pulls away from daily highs, holds above $2,200
Gold retreats from daily highs but holds comfortably above $2,200 in the American session on Thursday. The benchmark 10-year US Treasury bond yield stays near 4.2% after upbeat US data and makes it difficult for XAU/USD to gather further bullish momentum.
Google starts indexing Bitcoin addresses
Bitcoin address data is live on Google search results after users realized on Thursday that the tech giant started indexing Bitcoin blockchain data. However, mixed reactions have followed the tech giant's reversed stance on the cryptocurrency.
A Hollywood ending for fourth quarter GDP
The latest revisions put Q4 GDP at 3.4%, the second fastest quarterly growth rate in two years. Much of the upside was attributable to stronger consumer spending, yet fresh profits data affirmed it was a good quarter for the bottom line as well with profits up by the most since the Q2-2022.