GBP/USD Price Analysis: Thursday’s Doji tests buyers below 1.3200
- GBP/USD struggles for clear directions after a volatile day, sidelined of late.
- Doji signals reversal from previous rebound but MACD teases bull cross.
- Previous support from late January holds gate for buyers, 10-DMA challenges downside.

GBP/USD makes rounds to 1.3150 amid Friday’s initial Asian session, following a BOE-led volatile day that ended near the opening levels.
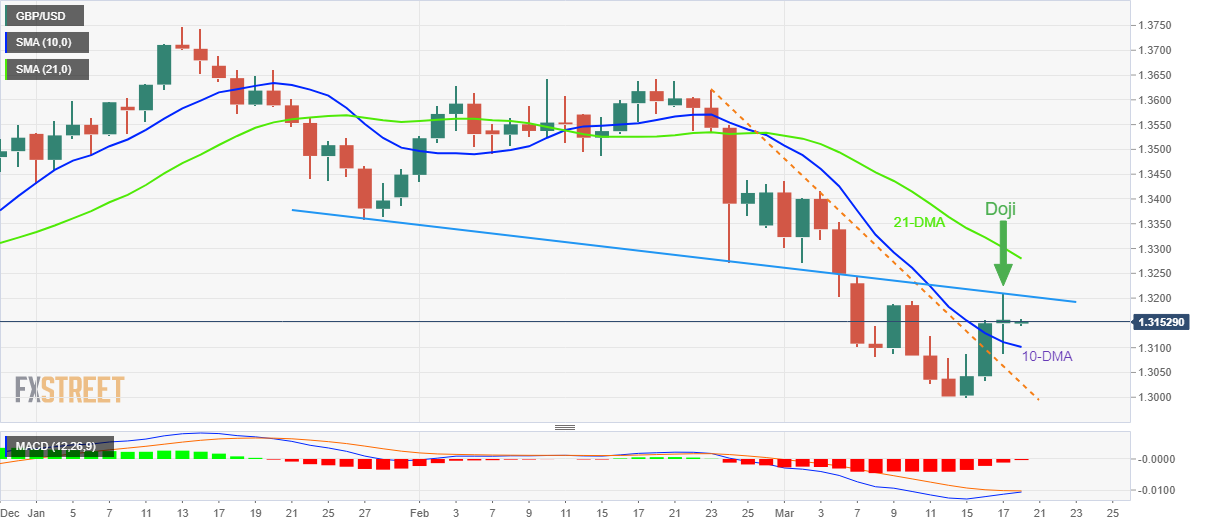
In doing so, the cable pair portrayed a Doji candlestick below a support-turned-resistance line from January 27, suggesting consolidation of the latest gains.
However, the MACD line is likely crossing the signal line from below, which in turn suggests a bull cross and may keep the buyers hopeful to conquer the 1.3205 resistance.
Following that, 21-DMA and January’s low, respectively around 1.3280 and 1.3360, will lure the GBP/USD buyers.
On the contrary, the 10-DMA level surrounding 1.3100 restricts the immediate downside of the pair ahead of a three-week-old previous resistance line near 1.3030.
During the quote’s weakness past 1.3030, the latest multi-month low of 1.3000 may act as an intermediate halt before direct GBP/USD bears towards November 2020 low around 1.2855.
GBP/USD: Daily chart
Trend: Sideways
Author

Anil Panchal
FXStreet
Anil Panchal has nearly 15 years of experience in tracking financial markets. With a keen interest in macroeconomics, Anil aptly tracks global news/updates and stays well-informed about the global financial moves and their implications.


