GBP/USD Price Analysis: Teases sellers above 1.1055 support, US PCE Inflation, UK GDP eyed


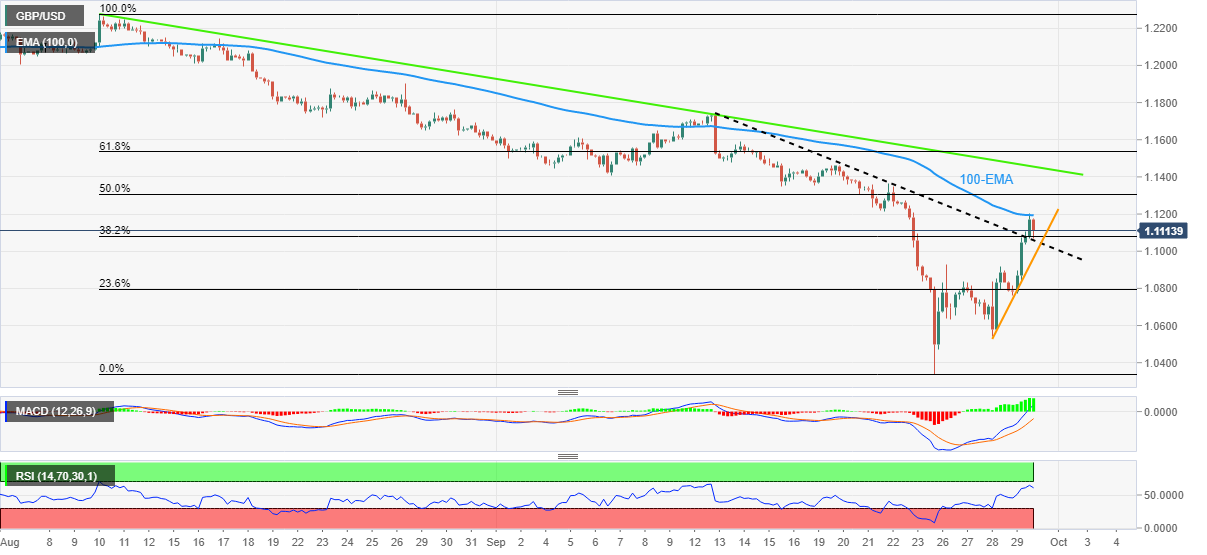
  • GBP/USD struggles to extend two-week-old resistance breakout as 100-EMA tests buyers.
  • Pre-data anxiety, nearly overbought RSI (14) challenge immediate upside.
  • Sellers need validation from two-day-old support, scheduled data to retake control.

GBP/USD struggles for clear directions around the weekly top after a three-day uptrend as traders await the key statistics from the US and the UK during Friday. That said, the quote currently seesaws between the 100-EMA and the resistance-turned-support line while taking rounds to 1.1120.

It’s worth noting that the nearly overbought RSI conditions join the 100-EMA and the previous resistance line to challenge the pair’s latest moves, as well as the pre-data anxiety.

Also read: GBP/USD pause on the way to 1.1200 ahead of UK GDP, US PCE Inflation

It should be noted, however, that the comparative fundamental challenges for the UK and a seven-week-old resistance line portray the bearish bias for the GBP/USD pair.

Hence, sellers should be on the lookout for entries on a clear downside break of the immediate support line, near 1.1055 by the press time. Following that, an upward sloping support line from Wednesday, near 1.0965, could challenge the pair’s further downside.

Alternatively, an upside clearance of the 100-EMA hurdle, around 1.1195 at the latest, could aim for the downward sloping resistance line from August 10, near 1.1455 now.

If at all the GBP/USD buyers manage to cross the 1.1455 hurdle, the monthly high surrounding 1.1740 will be on their radar.

GBP/USD: Four-hour chart

Trend: Pullback expected

Additional important levels

Overview
Today last price 1.1107
Today Daily Change -0.0012
Today Daily Change % -0.11%
Today daily open 1.1119
 
Trends
Daily SMA20 1.132
Daily SMA50 1.1719
Daily SMA100 1.1989
Daily SMA200 1.2605
 
Levels
Previous Daily High 1.1122
Previous Daily Low 1.0762
Previous Weekly High 1.1461
Previous Weekly Low 1.084
Previous Monthly High 1.2294
Previous Monthly Low 1.1599
Daily Fibonacci 38.2% 1.0984
Daily Fibonacci 61.8% 1.09
Daily Pivot Point S1 1.088
Daily Pivot Point S2 1.0642
Daily Pivot Point S3 1.0521
Daily Pivot Point R1 1.1239
Daily Pivot Point R2 1.136
Daily Pivot Point R3 1.1598


Share: Feed news

Information on these pages contains forward-looking statements that involve risks and uncertainties. Markets and instruments profiled on this page are for informational purposes only and should not in any way come across as a recommendation to buy or sell in these assets. You should do your own thorough research before making any investment decisions. FXStreet does not in any way guarantee that this information is free from mistakes, errors, or material misstatements. It also does not guarantee that this information is of a timely nature. Investing in Open Markets involves a great deal of risk, including the loss of all or a portion of your investment, as well as emotional distress. All risks, losses and costs associated with investing, including total loss of principal, are your responsibility. The views and opinions expressed in this article are those of the authors and do not necessarily reflect the official policy or position of FXStreet nor its advertisers. The author will not be held responsible for information that is found at the end of links posted on this page.

If not otherwise explicitly mentioned in the body of the article, at the time of writing, the author has no position in any stock mentioned in this article and no business relationship with any company mentioned. The author has not received compensation for writing this article, other than from FXStreet.

FXStreet and the author do not provide personalized recommendations. The author makes no representations as to the accuracy, completeness, or suitability of this information. FXStreet and the author will not be liable for any errors, omissions or any losses, injuries or damages arising from this information and its display or use. Errors and omissions excepted.

The author and FXStreet are not registered investment advisors and nothing in this article is intended to be investment advice.

Recommended content


Recommended content

Editors’ Picks

AUD/USD failed just ahead of the 200-day SMA

AUD/USD failed just ahead of the 200-day SMA

Finally, AUD/USD managed to break above the 0.6500 barrier on Wednesday, extending the weekly recovery, although its advance faltered just ahead of the 0.6530 region, where the key 200-day SMA sits.

AUD/USD News

EUR/USD met some decent resistance above 1.0700

EUR/USD met some decent resistance above 1.0700

EUR/USD remained unable to gather extra upside traction and surpass the 1.0700 hurdle in a convincing fashion on Wednesday, instead giving away part of the weekly gains against the backdrop of a decent bounce in the Dollar.

EUR/USD News

Gold keeps consolidating ahead of US first-tier figures

Gold keeps consolidating ahead of US first-tier figures

Gold finds it difficult to stage a rebound midweek following Monday's sharp decline but manages to hold above $2,300. The benchmark 10-year US Treasury bond yield stays in the green above 4.6% after US data, not allowing the pair to turn north.

Gold News

Bitcoin price could be primed for correction as bearish activity grows near $66K area

Bitcoin price could be primed for correction as bearish activity grows near $66K area

Bitcoin (BTC) price managed to maintain a northbound trajectory after the April 20 halving, despite bold assertions by analysts that the event would be a “sell the news” situation. However, after four days of strength, the tables could be turning as a dark cloud now hovers above BTC price.

Read more

Bank of Japan's predicament: The BOJ is trapped

Bank of Japan's predicament: The BOJ is trapped

In this special edition of TradeGATEHub Live Trading, we're joined by guest speaker Tavi @TaviCosta, who shares his insights on the Bank of Japan's current predicament, stating, 'The BOJ is Trapped.' 

Read more

Forex MAJORS

Cryptocurrencies

Signatures