• The Pound Sterling drops below 1.2000, set to finish the week with gains of more than 1.50%.
  • GBP/USD: Failure to hold above 1.2100 exacerbated a fall toward the November 24 low of 1.2049.
  • GBP/USD Price Analysis: A break below 1.2000 will exacerbate a fall towards 1.1800.

The GBP/USD hovers below 1.2100 amid a subdued trading session on low volume conditions spurred by the US Thanksgiving holiday, with the US equity market set to close on Friday, around 13:00 ET. Broad US Dollar (USD) strength spurred by a risk-off impulse caused a retracement on the GBP/USD. At the time of writing, the GBP/USD is trading at 1.2079, registering a minuscule loss of 0.27%.

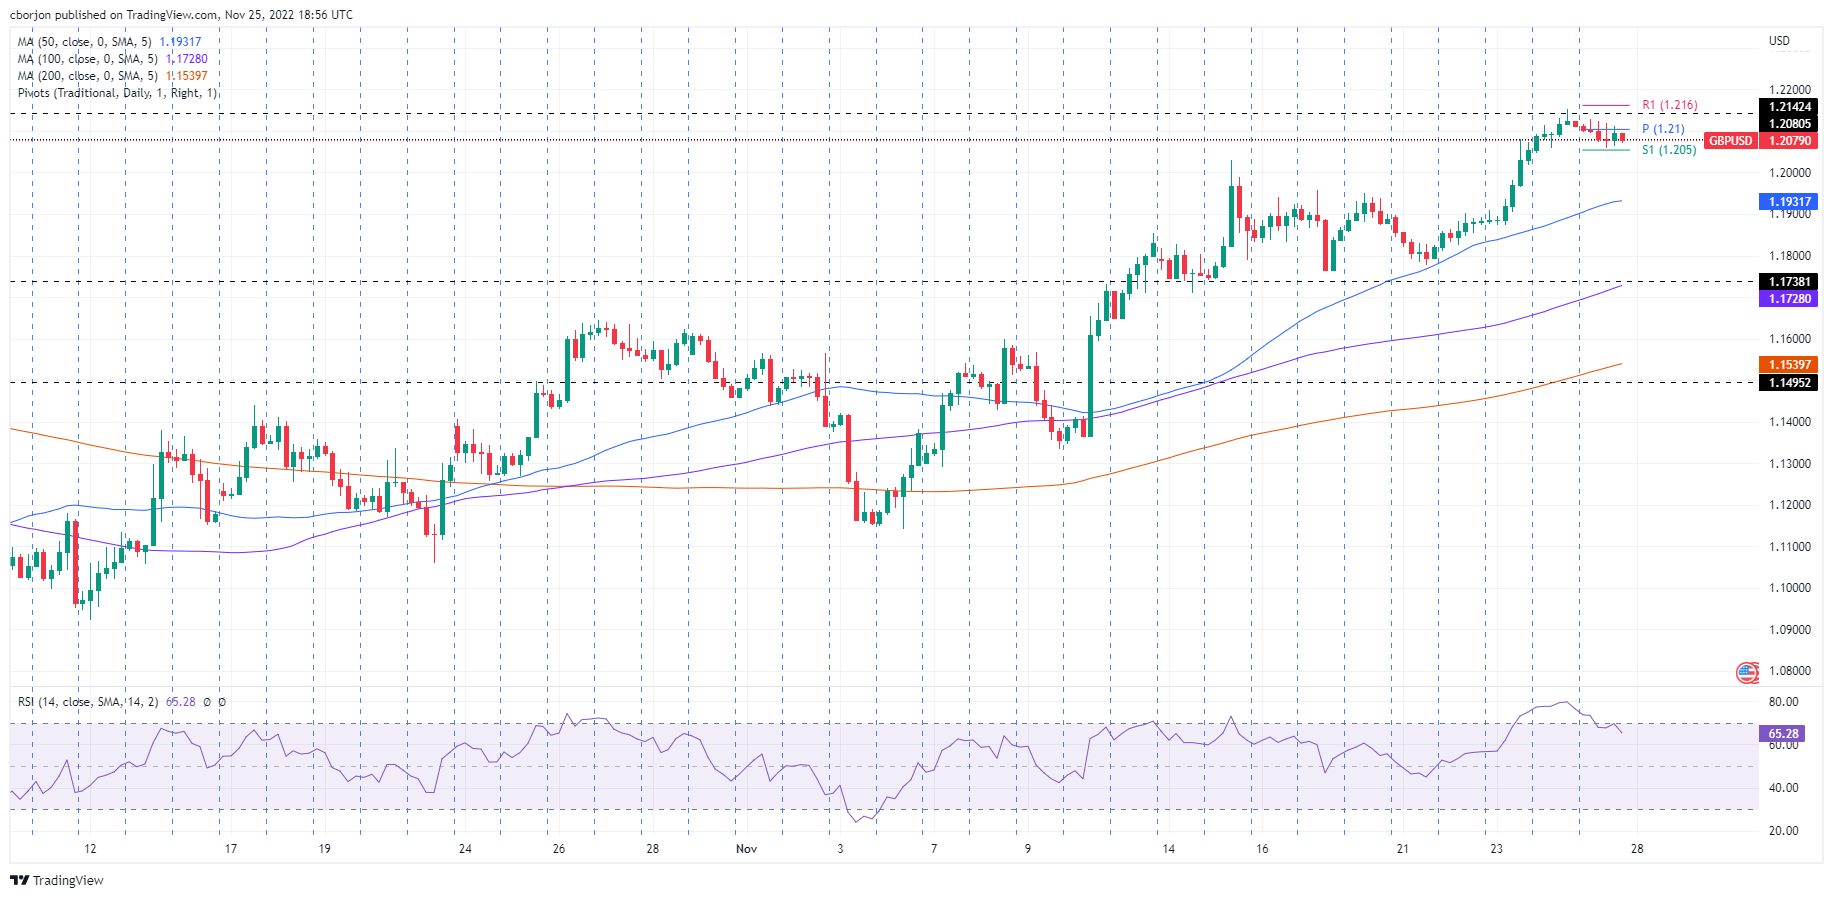
GBP/USD Price Analysis: Technical outlook

From a daily chart perspective, the GBP/USD remains neutral-upward biased, though lacking the force to break above the 200-day Exponential Moving Average (EMA) around 1.2181. November’s monthly high of around 1.2153 was shy of piercing the latter. Therefore, the GBP/USD would be subject to selling pressure, opening the door for further downside.

The GBP/USD 4-hour chart suggests that the major appears to be topping around the 1.2150 area in the near term, failing to break above the August 17 daily high of  1.2142, exacerbating a drop below 1.2100. Also, the Relative Strength Index (RSI) exiting from overbought conditions after peaking around 1.2150, which could mean two things: traders booking profits after a fall towards multi-decade lows around 1.0300 towards 1.2000, and also some US Dollar (USD) short covering.

Therefore, the GBP/USD path of least resistance is downwards. GBP/USD first support would be the S1 daily pivot point at 1.2050. Break below will expose the 1.2000 figure, followed by the 50-Exponential Moving Average (EMA) at around 1.1931.

GBP/USD Key Technical Levels

GBP/USD

Overview
Today last price 1.2083
Today Daily Change -0.0037
Today Daily Change % -0.31
Today daily open 1.212
 
Trends
Daily SMA20 1.1682
Daily SMA50 1.1404
Daily SMA100 1.1644
Daily SMA200 1.2192
 
Levels
Previous Daily High 1.2154
Previous Daily Low 1.2048
Previous Weekly High 1.2029
Previous Weekly Low 1.171
Previous Monthly High 1.1646
Previous Monthly Low 1.0924
Daily Fibonacci 38.2% 1.2113
Daily Fibonacci 61.8% 1.2088
Daily Pivot Point S1 1.206
Daily Pivot Point S2 1.2001
Daily Pivot Point S3 1.1954
Daily Pivot Point R1 1.2166
Daily Pivot Point R2 1.2213
Daily Pivot Point R3 1.2272


Share: Feed news

Information on these pages contains forward-looking statements that involve risks and uncertainties. Markets and instruments profiled on this page are for informational purposes only and should not in any way come across as a recommendation to buy or sell in these assets. You should do your own thorough research before making any investment decisions. FXStreet does not in any way guarantee that this information is free from mistakes, errors, or material misstatements. It also does not guarantee that this information is of a timely nature. Investing in Open Markets involves a great deal of risk, including the loss of all or a portion of your investment, as well as emotional distress. All risks, losses and costs associated with investing, including total loss of principal, are your responsibility. The views and opinions expressed in this article are those of the authors and do not necessarily reflect the official policy or position of FXStreet nor its advertisers. The author will not be held responsible for information that is found at the end of links posted on this page.

If not otherwise explicitly mentioned in the body of the article, at the time of writing, the author has no position in any stock mentioned in this article and no business relationship with any company mentioned. The author has not received compensation for writing this article, other than from FXStreet.

FXStreet and the author do not provide personalized recommendations. The author makes no representations as to the accuracy, completeness, or suitability of this information. FXStreet and the author will not be liable for any errors, omissions or any losses, injuries or damages arising from this information and its display or use. Errors and omissions excepted.

The author and FXStreet are not registered investment advisors and nothing in this article is intended to be investment advice.

Recommended content


Recommended content

Editors’ Picks

EUR/USD holds above 1.0700 ahead of key US data

EUR/USD holds above 1.0700 ahead of key US data

EUR/USD trades in a tight range above 1.0700 in the early European session on Friday. The US Dollar struggles to gather strength ahead of key PCE Price Index data, the Fed's preferred gauge of inflation, and helps the pair hold its ground. 

EUR/USD News

USD/JPY stays above 156.00 after BoJ Governor Ueda's comments

USD/JPY stays above 156.00 after BoJ Governor Ueda's comments

USD/JPY holds above 156.00 after surging above this level with the initial reaction to the Bank of Japan's decision to leave the policy settings unchanged. BoJ Governor said weak Yen was not impacting prices but added that they will watch FX developments closely.

USD/JPY News

Gold price oscillates in a range as the focus remains glued to the US PCE Price Index

Gold price oscillates in a range as the focus remains glued to the US PCE Price Index

Gold price struggles to attract any meaningful buyers amid the emergence of fresh USD buying. Bets that the Fed will keep rates higher for longer amid sticky inflation help revive the USD demand.

Gold News

Sei Price Prediction: SEI is in the zone of interest after a 10% leap

Sei Price Prediction: SEI is in the zone of interest after a 10% leap

Sei price has been in recovery mode for almost ten days now, following a fall of almost 65% beginning in mid-March. While the SEI bulls continue to show strength, the uptrend could prove premature as massive bearish sentiment hovers above the altcoin’s price.

Read more

US core PCE inflation set to signal firm price pressures as markets delay Federal Reserve rate cut bets

US core PCE inflation set to signal firm price pressures as markets delay Federal Reserve rate cut bets

The core PCE Price Index, which excludes volatile food and energy prices, is seen as the more influential measure of inflation in terms of Fed positioning. The index is forecast to rise 0.3% on a monthly basis in March, matching February’s increase. 

Read more

Forex MAJORS

Cryptocurrencies

Signatures