|

GBP/USD Price Analysis: Struggles at the 200-day EMA, plummets below 1.2000

  • Unable to crack the 200-day EMA, the GBP/USD fell beneath the psychological 1.2000 figure.
  • Short-term, the GBP/USD is downward biased, and once reclaiming 1.1900, it might fall to 1.1820s.

The GBP/USD moved downward on Monday, spurred by tensions arising in China due to Covid-19 zero-tolerance restrictions. US central bankers foresee a 2023 year of high-interest rates as they commit to higher for longer bolstered the US Dollar (USD). At the time of writing, the GBP/USD is trading at 1.1957, below its opening price by 0.07%, as the Asian session begins.

GBP/USD Price Analysis: Technical outlook

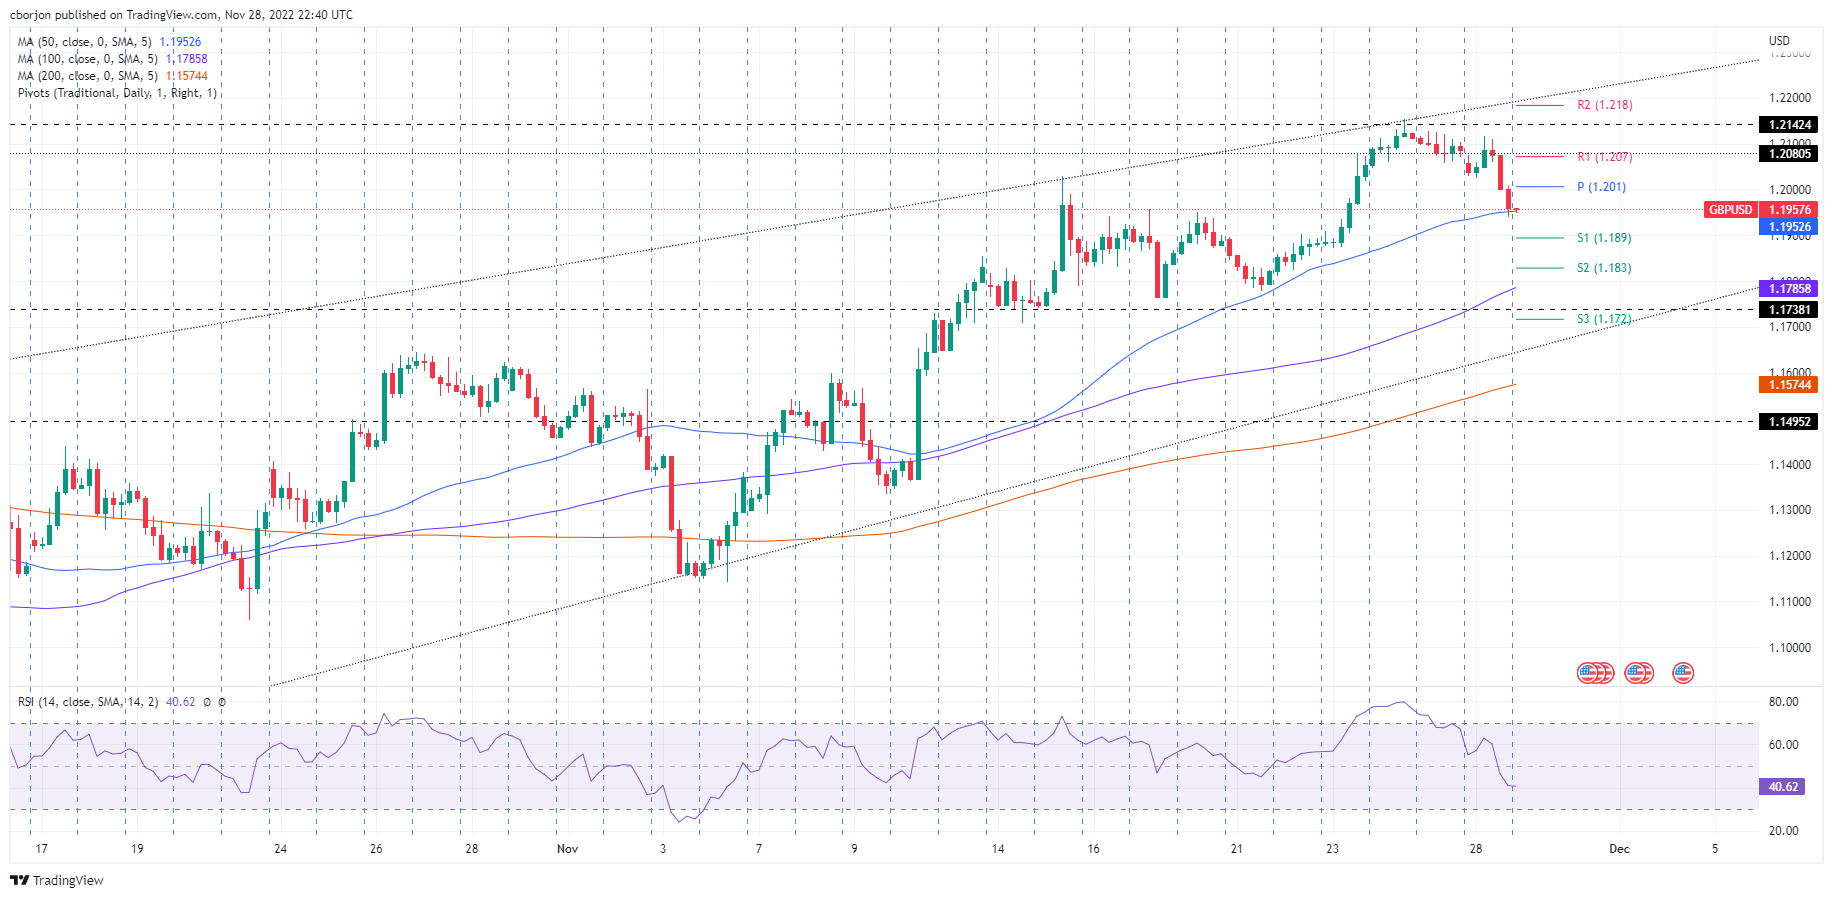
On Monday, the GBP/USD dived below the 1.2000 figure, exacerbated by Pound Sterling (GBP) buyers unable to crack the 200-day Exponential Moving Average (EMA) around 1.2170. Therefore, the GBP/USD dropped below the 1.2000 figure, eyeing a re-test of an upslope trendline drawn from September lows that pass around 1.1640/60. For that scenario to play out, the GBP/USD needs to drop below the November 23 daily low of 1.1872, which, once cleared, could pave the way for the previously mentioned upslope trendline.

Short term, the GBP/USD is testing the 50-Exponential Moving Average (EMA) in the 4-hour chart at 1.1953. The Relative Strength Index (RSI) sliding below the 50-midline suggests sellers outweigh buyers. Hence, the GBP/USD path of least resistance is downward biased.

The GBP/USD first support would be 1.1953. A decisive break will expose the 1.1900 figure, followed by the S1 daily pivot at 1.1890, ahead of the S2 daily pivot at 1.1828. On the flip side, the GBP/USD first resistance would be 1.2000, followed by the daily pivot point at 1.2010, followed by the R1 daily pivot at 1.2070.

GBP/USD Key Technical Levels

GBP/USD

Overview
Today last price1.1958
Today Daily Change-0.0139
Today Daily Change %-1.15
Today daily open1.2097
 
Trends
Daily SMA201.1706
Daily SMA501.1417
Daily SMA1001.1644
Daily SMA2001.2185
 
Levels
Previous Daily High1.2128
Previous Daily Low1.2058
Previous Weekly High1.2154
Previous Weekly Low1.1779
Previous Monthly High1.1646
Previous Monthly Low1.0924
Daily Fibonacci 38.2%1.2085
Daily Fibonacci 61.8%1.2101
Daily Pivot Point S11.2061
Daily Pivot Point S21.2025
Daily Pivot Point S31.1992
Daily Pivot Point R11.2131
Daily Pivot Point R21.2164
Daily Pivot Point R31.22

Author

Christian Borjon Valencia

Markets analyst, news editor, and trading instructor with over 14 years of experience across FX, commodities, US equity indices, and global macro markets.

More from Christian Borjon Valencia
Share:

Editor's Picks

EUR/USD faces some resistance near 100-SMA on H4, around 1.1830 zone

The EUR/USD pair gains some follow-through positive traction for the second consecutive day and climbs to the 1.1830 region during the Asian session on Thursday. The US Dollar remains on the back foot amid concerns about the economic fallout from US President Donald Trump's erratic trade policies and acts as a tailwind for spot prices.

GBP/USD extends recovery to near 20-day EMA as US Dollar weakens

The Pound Sterling holds onto weekly gains around 1.3565 against the US Dollar during the Asian trading session on Thursday. The GBP/USD pair trades firmly as the US Dollar remains under pressure due to uncertainty surrounding the United States trade policy outlook.

Gold struggle with $5,200 extends ahead of more US-Iran talks

Gold is replicating the recovery moves seen in Wednesday’s Asian trading early Thursday, as buyers continue to flirt with the $5,200 level. Sustained US Dollar weakness and looming US-Iran talks aid the bright metal’s rebound.  

Stellar: Relief bounce fades as bearish undertone persists

Stellar is trading around $0.16 at the time of writing on Thursday after rebounding more than 8% in the previous day. Derivatives data paints a negative picture as XLM’s short bets hit a monthly high while Open Interest continues to decline.

Nvidia delivers another monster earnings report, and forecasts big things to come

It was another monster earnings report from Nvidia for fiscal Q4. Revenues were $68.1bn, smashing estimates of $65bn. Gross profit margin was a healthy 75%, up from 73.5% in the prior quarter, and the outlook for this quarter was monstrous.

Solana strikes key resistance with double-digit gains

Solana trades at $88 at press time on Thursday, after an 11% upswing the previous day within a broader consolidation range of roughly three weeks. Institutional demand for Solana heightens as US spot SOL Exchange Traded Funds record $30 million of inflow on Wednesday.