|

GBP/USD Price Analysis: Stills bearish on buyers failure at 1.2220

  • GBP/USD extends its gains to two straight weeks, gains some 1.49%.
  • From a daily chart perspective, the GBP/USD is still downward biased, facing solid resistance around 1.2200.
  • GBP/USD Price Analysis: Unless buyers reclaim 1.2245, the pair remains tilted downwards.

The British pound finished the week on the right foot and recorded its second consecutive week in the green; it printed solid gains of 1.49%, amidst an upbeat market mood, portrayed by US equities closing higher on Friday. In the FX space, the GBP/USD is trading at 1.2170, 0.05% down, during the North American session.

GBP/USD Price Analysis: Technical outlook

The GBP/USD is still neutral-to-downward biased, trapped within the 50 and 20-day EMAs, as depicted by the daily chart. Worth noting that earlier in the European session, GBP/USD buyers broke above the 50-day EMA but could not hold the fort, and the pound tumbled towards and hit its daily low at 1.2062 before rebounding towards current price levels.

If GBP/USD buyers want to regain control, they must reclaim 1.2300; otherwise, sellers remain in charge.

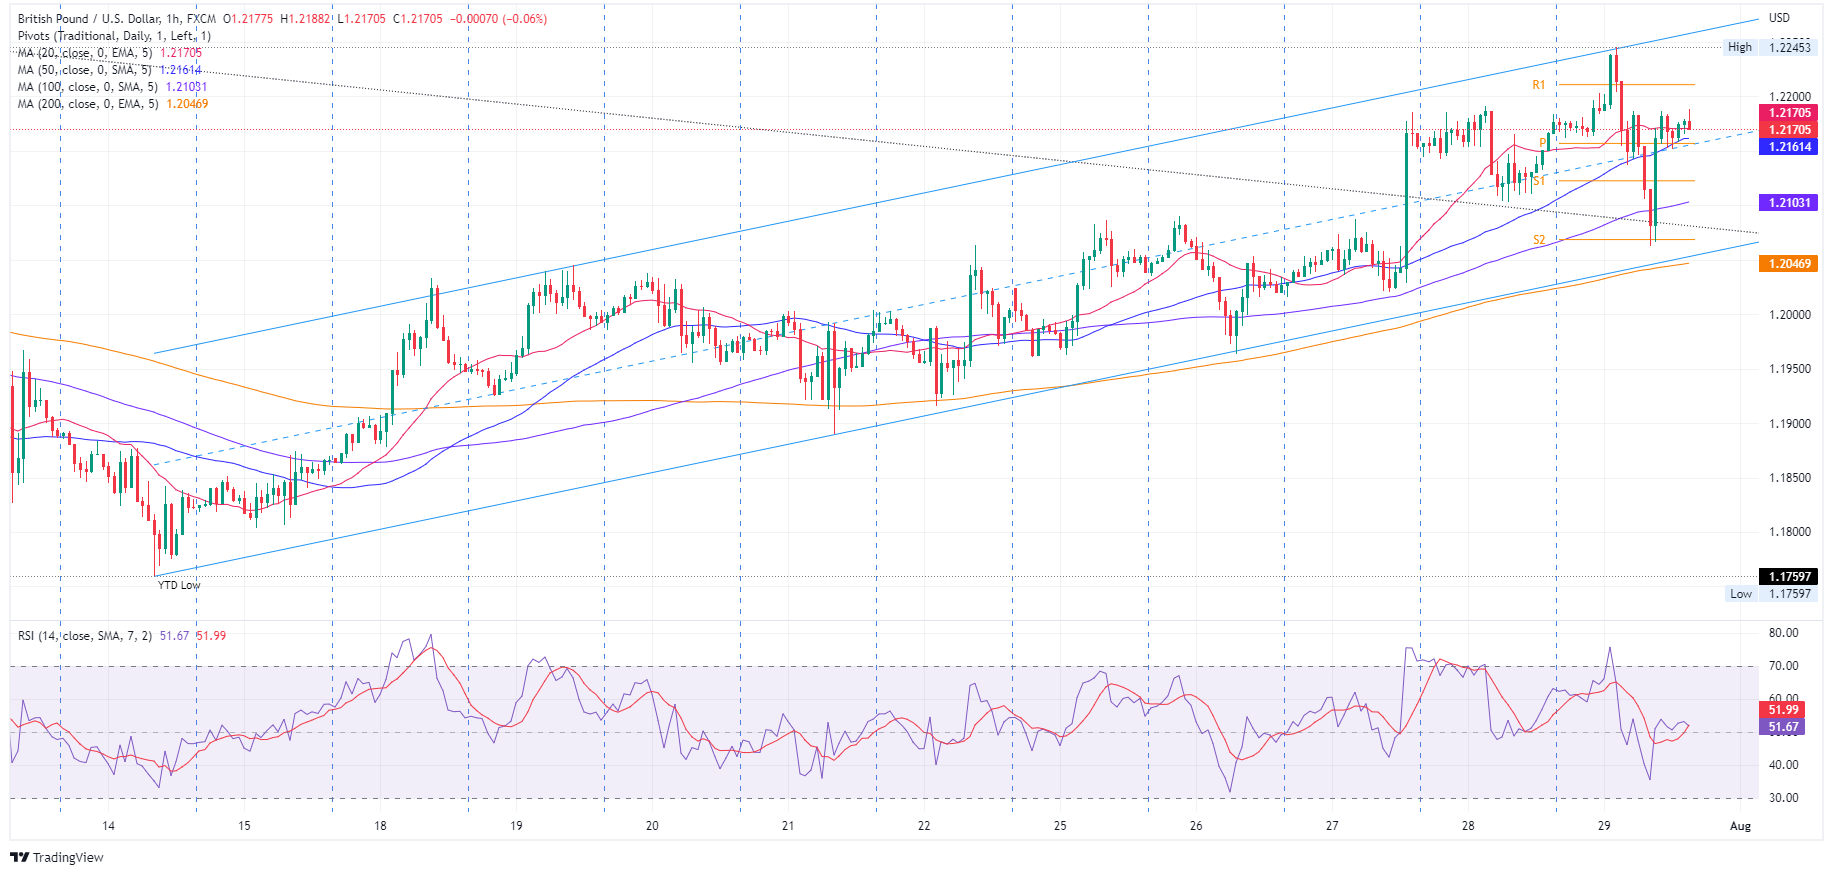
GBP/USD 1-hour chart

In the near term, the GBP/USD is neutral-upwards biased. Since July 14, after reaching a daily low at 1.1759, the major began trending higher, within a 200-pip width ascending channel, which put a lid on Friday’s rally around 1.2245, right at the top of the channel. Even though the GBP/USD plunged towards 1.2065, the S1 pivot point cable recovered some ground and is trading above the confluence of all the hourly EMAs and the daily pivot.

Therefore, the GBP/USD first resistance would be the R1 daily pivot at 1.2210. Break above will expose the top-trendline of the ascending channel around 1.2245, followed by the 1.2300 figure. On the flip side, if the GBP/USD falls below the ascending channel mid-line around 1.2150, it will send the pair sliding towards the bottom-trendline of the channel at around 1.2050-60.

GBP/USD Key Technical Levels

GBP/USD

Overview
Today last price1.2170
Today Daily Change0.0002
Today Daily Change %0.02
Today daily open1.2177
 
Trends
Daily SMA201.199
Daily SMA501.2229
Daily SMA1001.2534
Daily SMA2001.2997
 
Levels
Previous Daily High1.2192
Previous Daily Low1.2104
Previous Weekly High1.2064
Previous Weekly Low1.1854
Previous Monthly High1.2617
Previous Monthly Low1.1934
Daily Fibonacci 38.2%1.2158
Daily Fibonacci 61.8%1.2137
Daily Pivot Point S11.2123
Daily Pivot Point S21.207
Daily Pivot Point S31.2036
Daily Pivot Point R11.2211
Daily Pivot Point R21.2245
Daily Pivot Point R31.2299

Author

Christian Borjon Valencia

Markets analyst, news editor, and trading instructor with over 14 years of experience across FX, commodities, US equity indices, and global macro markets.

More from Christian Borjon Valencia
Share:

Editor's Picks

AUD/USD struggles to recover as hawkish Fed bets escalate

The Australian Dollar is under pressure against the US Dollar as traders have raised bets supporting interest rate hikes by the Federal Reserve this year, with the AUD/USD pair posting a fresh almost eight-week low at around 0.7025. Hawkish Fed bets have accelerated following the release of the surprisingly strong United States Nonfarm Payroll (NFP) data for May.

USD/JPY holds higher ground toward 160.50 despite 'Yentervention' fears

USD/JPY holds higher ground toward 160.50 in Monday's Asian trading, despite intervention fears. Japan’s revised GDP print, which confirmed that the economy lost momentum in the first quarter, weighs on the Japanese Yen. Meanwhile, Friday's upbeat US NFP report and fresh Israel-Iran attacks favor the US Dollar bulls, underpinning the currency pair.

Gold remains heavy near $4,300 on Mideast woes, Fed rate hike bets

Gold remains vulnerable near $4,300 in European trading on Monday, following a modest Asian bounce to the $4,350-$4,355 area. Renewed hostilities in the Gulf push Crude Oil prices higher, fanning inflationary concerns and bolstering bets for more hawkish central banks. That weighs negatively on the Gold, as it mires in three-month lows.

Solana: ETF outflows and bearish sentiment reinforce downside risks

Solana (SOL) remains under pressure, trading below $66 on Monday after losing nearly 20% in the previous week. Institutional demand weakened with spot Exchange Traded Funds recording a net outflow of over $6.5 million last week, snapping a four-week streak of inflows.

$1.75 trillion: Is SpaceX the most popular IPO in history, or the most engineered?

On June 12, the largest initial public offering (IPO) in history is set to hit the tape, and almost nobody is asking whether the price is right, because almost everybody already wants in.

The US economy defies the rules: 100 days into the Oil shock and the recession signal is still missing

More than three months after the start of the Iran war and the resulting disruption to global energy markets, the US economy continues to display remarkable resilience. The conflict has triggered a sharp rise in Oil prices, reignited inflationary pressures and fueled widespread concerns about a potential economic slowdown.