- GBP/USD regains positive traction on Friday and reverses a major part of the overnight losses.
- The four-week-old trading range warrants caution before placing aggressive directional bets.
- Bearish oscillators on the daily chart support prospects for a break below the 200-day SMA.
The GBP/USD pair attracts some dip-buying on Friday and recovers a major part of the previous day's slide to the 1.1920-1.1915 support zone. The pair maintains its bid tone around the 1.2000 psychological mark through the early North American session and is supported by broad-based US Dollar weakness.
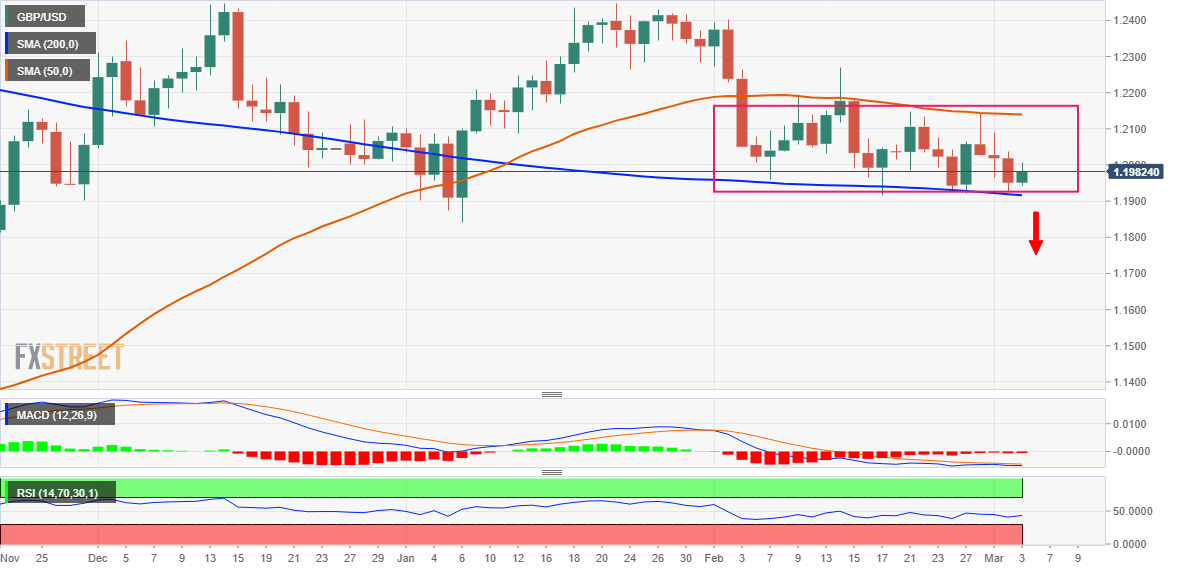
Looking at the broader picture, the two-way price moves witnessed over the past four weeks or so constitute the formation of a rectangle on the daily chart. The lower end of the trading band coincides with a technically significant 200-day Simple Moving Average (SMA) and should now act as a pivotal point.
A convincing break below will make the GBP/USD pair vulnerable to weaken further below the 1.1900 mark and test the YTD low, around the 1.1840 region touched in January. Some follow-through selling will complete a bearish double-top pattern formed near the 1.2445-1.2450 area and pave the way for deeper losses.
On the flip side, the overnight swing high, around the 1.2035 area, might act as an immediate hurdle ahead of the 1.2065-1.2070 supply zone. Any subsequent move-up could attract fresh sellers near the 1.2100 mark and remain capped near the 50-day SMA strong barrier, currently around the 1.2135-1.2140 area.
Some follow-through buying could lift the GBP/USD pair towards the 1.2200 mark en route to the February 14 peak, around the 1.2265-1.2270 region. A sustained strength beyond the latter will suggest that the slide from the 1.2445-1.2450 zone has run its course and shift the near-term bias back in favour of bullish traders.
GBP/USD daily chart
Key levels to watch
Information on these pages contains forward-looking statements that involve risks and uncertainties. Markets and instruments profiled on this page are for informational purposes only and should not in any way come across as a recommendation to buy or sell in these assets. You should do your own thorough research before making any investment decisions. FXStreet does not in any way guarantee that this information is free from mistakes, errors, or material misstatements. It also does not guarantee that this information is of a timely nature. Investing in Open Markets involves a great deal of risk, including the loss of all or a portion of your investment, as well as emotional distress. All risks, losses and costs associated with investing, including total loss of principal, are your responsibility. The views and opinions expressed in this article are those of the authors and do not necessarily reflect the official policy or position of FXStreet nor its advertisers. The author will not be held responsible for information that is found at the end of links posted on this page.
If not otherwise explicitly mentioned in the body of the article, at the time of writing, the author has no position in any stock mentioned in this article and no business relationship with any company mentioned. The author has not received compensation for writing this article, other than from FXStreet.
FXStreet and the author do not provide personalized recommendations. The author makes no representations as to the accuracy, completeness, or suitability of this information. FXStreet and the author will not be liable for any errors, omissions or any losses, injuries or damages arising from this information and its display or use. Errors and omissions excepted.
The author and FXStreet are not registered investment advisors and nothing in this article is intended to be investment advice.
Recommended content
Editors’ Picks
EUR/USD remains stuck near 1.0800 after US employment data

EUR/USD struggles to find direction and moves up and down in a narrow channel at around 1.0800 in the American session on Wednesday. The data from the US showed that employment in the private sector rose less than expected in November and helped the pair limit its losses.
GBP/USD battles 1.2600 after US ADP data

GBP/USD is having a difficult time stabilizing above 1.2600 after closing the first two trading days of the week in negative territory. Despite the weaker-than-expected ADP Employment Change data, the US Dollar stays relatively resilient amid cautious market stance.
Gold rebounds to $2,030 as US yields stretch lower

Gold recovered toward $2,030 after testing $2,020 earlier in the day. The benchmark 10-year US Treasury bond yield declined to its lowest level in three months below 4.15% after US employment data and helped XAU/USD gain traction.
Bitcoin-based meme coin ORDI price action wobbles after 1,100% rally

The Bitcoin-based BRC-20 meme coin, which had people confused as being an actual valuable token, is now slowly creeping up to that status. ORDI price rise over the past couple of days has been astonishing, and with BTC driving the price and crossing $44,000, ORDI is also gaining rapidly. But not for long.
The Dollar is struggling to trend

For the last three trading sessions, the dollar index has been crossing up and down the 200-day moving average every day. All in all, the flirting with this level has been going on for more than three weeks, during which neither bulls nor bears were able to form a stable trend.