|

GBP/USD Price Analysis: Stays firm below 1.2700, bearishly biased

  • GBP/USD is steady as worse-than-expected US Consumer Confidence report, weighs on US Dollar.
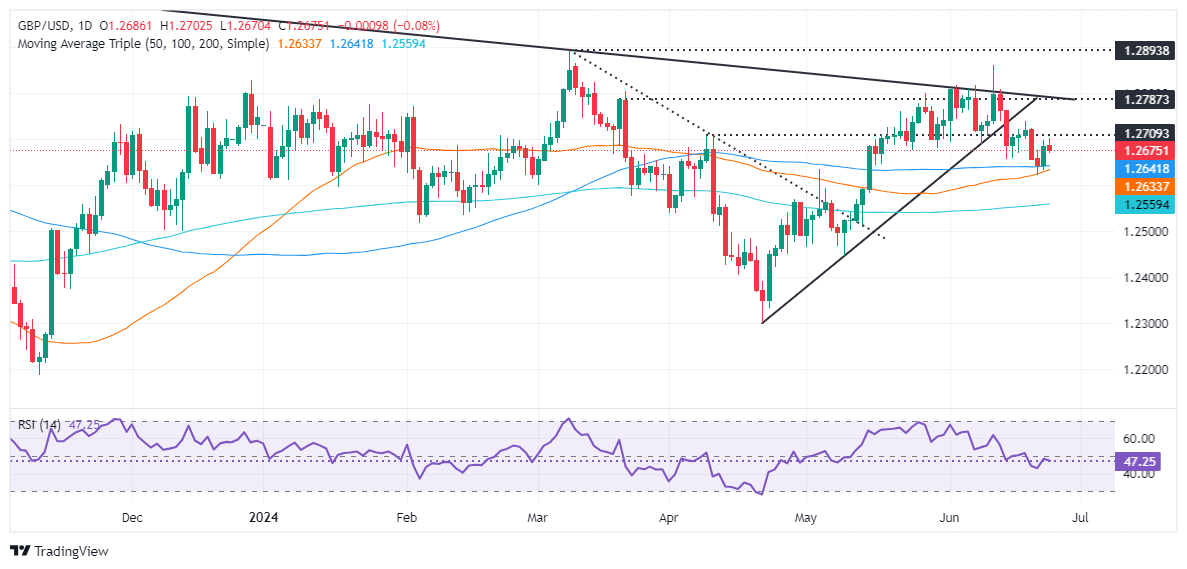
  • Technical outlook shows a 'bullish piercing' pattern, but momentum favors sellers, with RSI standing bearish.
  • Key support levels will be 100-DMA and the May 3 high at 1.2640/34, with further losses eyed beneath the psychological level of 1.2600.
  • Key resistance levels are 1.2700 and previous support trendline turned resistance at 1.2730/40.

The Pound Sterling stayed firm against the Greenback on Tuesday, even though the latter remained positive, and a worse-than-expected Consumer Confidence report capped the US Dollar advance. Therefore, the GBP/USD trades at 1.2678, virtually unchanged.

GBP/USD Price Analysis: Technical outlook

The pair formed a ‘bullish piercing’ pattern, hinting that traders could challenge the next resistance seen at 1.2700, yet buyers remain reluctant to lift the GBP/USD towards that level.

Momentum still favors sellers, as depicted by the Relative Strength Index (RSI), which remains bearish and aims lower. That said, the GBP/USD path of least resistance is downwards.

The first support will be the confluence of the 100-day moving average (DMA) and the May 3 high-turned support at around 1.2640/34, closely followed by the 50-DMA at 1.2632. Once that area is surpassed, the psychological 1.2600 mark would be up next, ahead of the 200-DMA at 1.2555.

For a bullish continuation, traders must claim 1.2700 and clear a previous support trendline turned resistance at around 1.2730/40.

GBP/USD Price Action – Daily Chart

GBP/USD

Overview
Today last price1.2677
Today Daily Change-0.0008
Today Daily Change %-0.06
Today daily open1.2685
 
Trends
Daily SMA201.2733
Daily SMA501.2629
Daily SMA1001.2641
Daily SMA2001.2558
 
Levels
Previous Daily High1.2698
Previous Daily Low1.2633
Previous Weekly High1.274
Previous Weekly Low1.2623
Previous Monthly High1.2801
Previous Monthly Low1.2446
Daily Fibonacci 38.2%1.2673
Daily Fibonacci 61.8%1.2658
Daily Pivot Point S11.2646
Daily Pivot Point S21.2607
Daily Pivot Point S31.2581
Daily Pivot Point R11.2711
Daily Pivot Point R21.2737
Daily Pivot Point R31.2776

Author

Christian Borjon Valencia

Christian Borjon began his career as a retail trader in 2010, mainly focused on technical analysis and strategies around it. He started as a swing trader, as he used to work in another industry unrelated to the financial markets.

More from Christian Borjon Valencia
Share:

Markets move fast. We move first.

Orange Juice Newsletter brings you expert driven insights - not headlines. Every day on your inbox.

By subscribing you agree to our Terms and conditions.

Editor's Picks

EUR/USD trades around 1.1700 after rebounding from 50-day EMA

EUR/USD gains ground after three days of losses, trading around 1.1700 during the Asian hours on Wednesday. On the daily chart, technical analysis indicates a potential for a bearish bias; the 14-day Relative Strength Index at 47 confirms waning momentum.

GBP/USD climbs above 1.3500 as US Dollar weakens ahead of ISM Services PMI

GBP/USD gains some ground after registering modest gains in the previous session, trading around 1.3510 during the Asian hours on Wednesday. The pair edges higher as the US Dollar struggles ahead of the US ISM Services Purchasing Managers’ Index and JOLTs job openings due later in the day.

Gold pulls back from $4,500 amid profit-taking ahead of key US macro data

Gold struggles to capitalize on its strong weekly gains registered over the past two days and faces rejection near the $4,500 psychological mark, or over a one-week high touched during the Asian session on Wednesday. As investors digest the recent US attack on Venezuela, the prevalent risk-on environment prompts some profit-taking around the commodity. 

Bitcoin, Ethereum and Ripple cool off as rally stalls near key resistance zones

Bitcoin, Ethereum, and Ripple prices are taking a breather on Wednesday near their key resistance levels following the recent surge. BTC faces rejection at the $94,253 level, while ETH and XRP follow BTC’s footsteps, struggling near $3,308 and $2.35, respectively.

Implications of US intervention in Venezuela

Events in Venezuela are top of mind for market participants, and while developments are associated with an elevated degree of uncertainty, we are not making any changes to our markets or economic forecasts as a result of the deposition of Nicolás Maduro. 

Aave Price Forecast: AAVE eyes bullish breakout as on-chain and derivatives data turns supportive

Aave (AAVE) price hovers around $172 on Wednesday, nearing the upper trendline of the falling parallel channel pattern. A break above this technical pattern favors the bulls.