GBP/USD Price Analysis: Slides below 1.3000 despite solid UK data
- GBP/USD drops below the 1.3000 mark, trading with over 0.20% losses as strong US Dollar prevails.
- Technical outlook shows momentum remains bullish with RSI still positive despite recent dip.
- Key support levels to watch: 1.2894, 1.2861, and 1.2817; resistance at 1.3044 and 1.3100 if buyers reclaim 1.3000.

The Pound Sterling reversed its course on Thursday against the Greenback, even though UK data was solid, while the US jobs market shows signs of weakness. Nevertheless, elevated US Treasury yields and a strong US Dollar pushed the GBP/USD below the 1.3000 figure, trading with more than 0.20% losses.
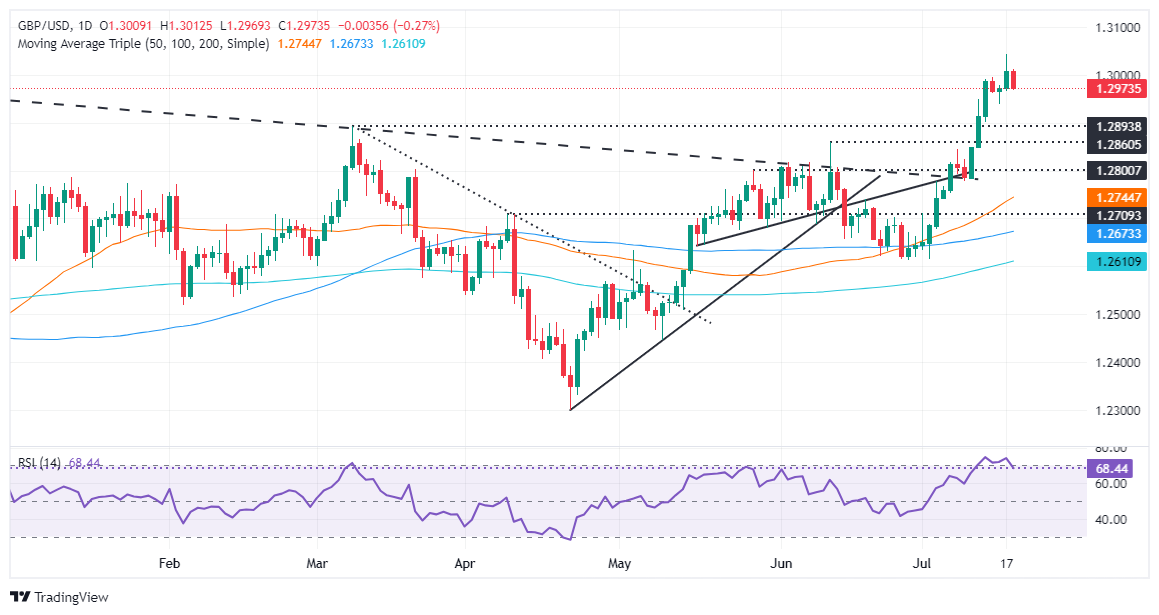
GBP/USD Price Analysis: Technical outlook
GBP/USD buyers had failed to cling to gains above the 1.3000 figure, and the pair reversed its course beneath the former. However, momentum remains on the buyers’ side, with the Relative Strength Index (RSI), which remains bullish despite exiting overbought conditions.
If sellers keep the major below 1.3000 and achieve a daily close below the latter, that will expose key support levels.
On further weakness, the GBP/USD first demand zone would be the March 8 peak turned support at 1.2894, followed by the June 12 high at 1.2861. Once those levels are cleared, the next stop would be the June 4 high at 1.2817.
If buyers reclaim 1.3000, the first resistance would be the yearly peak at 1.3044, ahead of testing 1.3100. On further strength, the next stop would be 1.3142, last year’s high.
GBP/USD Price Action – Daily Chart
Pound Sterling FAQs
The Pound Sterling (GBP) is the oldest currency in the world (886 AD) and the official currency of the United Kingdom. It is the fourth most traded unit for foreign exchange (FX) in the world, accounting for 12% of all transactions, averaging $630 billion a day, according to 2022 data. Its key trading pairs are GBP/USD, aka ‘Cable’, which accounts for 11% of FX, GBP/JPY, or the ‘Dragon’ as it is known by traders (3%), and EUR/GBP (2%). The Pound Sterling is issued by the Bank of England (BoE).
The single most important factor influencing the value of the Pound Sterling is monetary policy decided by the Bank of England. The BoE bases its decisions on whether it has achieved its primary goal of “price stability” – a steady inflation rate of around 2%. Its primary tool for achieving this is the adjustment of interest rates. When inflation is too high, the BoE will try to rein it in by raising interest rates, making it more expensive for people and businesses to access credit. This is generally positive for GBP, as higher interest rates make the UK a more attractive place for global investors to park their money. When inflation falls too low it is a sign economic growth is slowing. In this scenario, the BoE will consider lowering interest rates to cheapen credit so businesses will borrow more to invest in growth-generating projects.
Data releases gauge the health of the economy and can impact the value of the Pound Sterling. Indicators such as GDP, Manufacturing and Services PMIs, and employment can all influence the direction of the GBP. A strong economy is good for Sterling. Not only does it attract more foreign investment but it may encourage the BoE to put up interest rates, which will directly strengthen GBP. Otherwise, if economic data is weak, the Pound Sterling is likely to fall.
Another significant data release for the Pound Sterling is the Trade Balance. This indicator measures the difference between what a country earns from its exports and what it spends on imports over a given period. If a country produces highly sought-after exports, its currency will benefit purely from the extra demand created from foreign buyers seeking to purchase these goods. Therefore, a positive net Trade Balance strengthens a currency and vice versa for a negative balance.
Author

Christian Borjon Valencia
FXStreet
Markets analyst, news editor, and trading instructor with over 14 years of experience across FX, commodities, US equity indices, and global macro markets.


