|

GBP/USD Price Analysis: Shooting star emerges as sellers eye 1.2600

  • GBP/USD slides 0.04%, peaking at 1.2746 in early North American trading.
  • Technicals show a bearish trend with a 'shooting star' pattern and momentum with sellers.
  • Support on May 21 low of 1.2686, May 16 low of 1.2643, and 1.2600 psychological level.
  • Resistance at 50-hour SMA (1.2721), 100-hour SMA (1.2712), weekly high of 1.2761; potential target at 1.2800.

Early during the North American session, the British Pound dropped against the Greenback after data from the United States showed that business activity was picking up. Alongside that, inflationary pressures rose, sparking investors' fears that the Fed would delay cutting rates later during the year. The GBP/USD trades at 1.2711 after hitting a high of 1.2746, down 0.04%

GBP/USD Price Analysis: Technical outlook

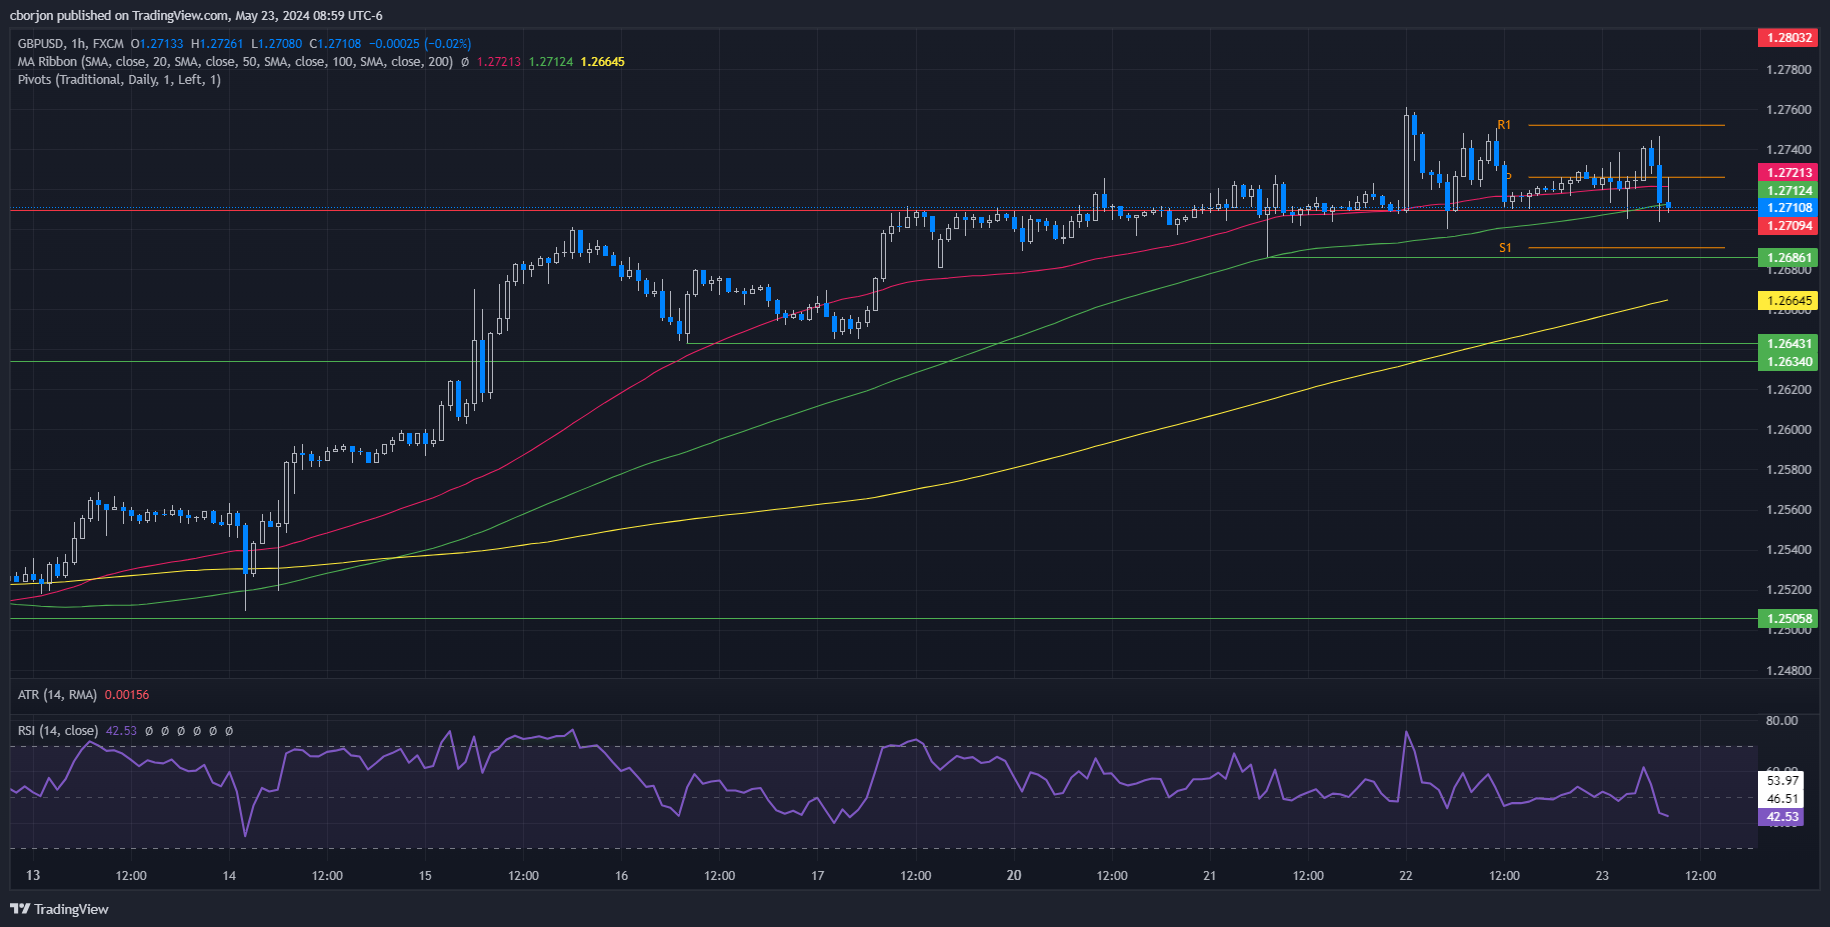
The GBP/USD edges are lower after printing a ‘shooting star’ on Wednesday, a prelude to lower prices. Today’s price action witnessed a jump toward a high of 1.2750, but it still failed to crack the current week’s high of 1.2761, which opened the door for further losses.

In the short term, the GBP/USD one-hour chart suggests the pair is range-bound, capped on the upside by the 50-hour SMA at 1.2721 and the 100-hour SMA at 1.2712. However, momentum supports sellers, as shown by the Relative Strength Index (RSI), which remains bearish and hovers at its lowest level since May 17.

Therefore, if the major drops beneath 1.2700, the next support would be the May 21 low of 1.2686, followed by the May 16 low of 1.2643 and the psychological 1.2600 mark.

Conversely, if buyers lift the exchange rate above 1.2746, that will sponsor a test of the weekly high of 1.2761. Further strength and the pair could aim for 1.2800.

GBP/USD Price Action – Hourly Chart

GBP/USD

Overview
Today last price1.2713
Today Daily Change-0.0004
Today Daily Change %-0.03
Today daily open1.2717
 
Trends
Daily SMA201.2581
Daily SMA501.2582
Daily SMA1001.2633
Daily SMA2001.2541
 
Levels
Previous Daily High1.2761
Previous Daily Low1.27
Previous Weekly High1.2712
Previous Weekly Low1.2509
Previous Monthly High1.2709
Previous Monthly Low1.23
Daily Fibonacci 38.2%1.2738
Daily Fibonacci 61.8%1.2724
Daily Pivot Point S11.2691
Daily Pivot Point S21.2665
Daily Pivot Point S31.263
Daily Pivot Point R11.2752
Daily Pivot Point R21.2787
Daily Pivot Point R31.2813

Author

Christian Borjon Valencia

Christian Borjon began his career as a retail trader in 2010, mainly focused on technical analysis and strategies around it. He started as a swing trader, as he used to work in another industry unrelated to the financial markets.

More from Christian Borjon Valencia
Share:

Markets move fast. We move first.

Orange Juice Newsletter brings you expert driven insights - not headlines. Every day on your inbox.

By subscribing you agree to our Terms and conditions.

Editor's Picks

EUR/USD struggles for direction amid USD gains

EUR/USD is trimming part of its earlier gains, coming under some mild downside pressure near 1.1730 as the US Dollar edges higher. Markets are still digesting the Fed’s latest rate decision, while also looking ahead to more commentary from Fed officials in the sessions ahead.

GBP/USD drops to daily lows near 1.3360

Disappointing UK data weighed on the Sterling towards the end of the week, triggering a pullback in GBP/USD to fresh daily lows near 1.3360. Looking ahead, the next key event across the Channel is the BoE meeting on December 18.

Gold losses momentum, challenges $4,300

Gold now gives away some gains and disputes the key $4,300 zone per troy ounce following earlier multi-week highs. The move is being driven by expectations that the Fed will deliver further rate cuts next year, with the yellow metal climbing despite a firmer Greenback and rising US Treasury yields across the board.

Litecoin Price Forecast: LTC struggles to extend gains, bullish bets at risk

Litecoin (LTC) price steadies above $80 at press time on Friday, following a reversal from the $87 resistance level on Wednesday. Derivatives data suggests a bullish positional buildup while the LTC futures Open Interest declines, flashing a long squeeze risk.

Big week ends with big doubts

The S&P 500 continued to push higher yesterday as the US 2-year yield wavered around the 3.50% mark following a Federal Reserve (Fed) rate cut earlier this week that was ultimately perceived as not that hawkish after all. The cut is especially boosting the non-tech pockets of the market.

Aave Price Forecast: AAVE primed for breakout as bullish signals strengthen

Aave (AAVE) price is trading above $204 at the time of writing on Friday and approaching the upper boundary of its descending parallel channel; a breakout from this structure would favor the bulls.