|

GBP/USD Price Analysis: ‘Sell the bounce’ as bear flag remains in play

  • GBP/USD remains a ‘sell the bounce’ trade after hitting 22-month lows.
  • Risk-aversion, BOE’s recession projection to keep any GBP rebound limited.
  • Bear flag confirmation on the 4-hour chart points to more pain for cable.

GBP/USD is seeing a dead cat bounce above 1.2300, reversing quickly from fresh 22-month lows reached at 1.2276 in the last hour.

The US dollar remains in charge and advanced to the highest levels since December 2002 when compared to its majors, adding to the renewed weakness in the cable.

The sentiment around the GBP remains undermined after the BOE projected a recession for the UK economy in Q4 2022 while hiking the key rate by 25 bps to 1% on Super Thursday.

On the other hand, despite a contraction in the US Q1 GDP, Fed Chair Jerome Powell remains confident on the economy and labor market, suggesting 50 bps rate hikes in the next two policy meetings.

The Fed-BOE divergence on the monetary policy, as well as, the economic outlook will likely keep GBP/USD’s bearish potential intact. The focus now shifts towards the US NFP data and speeches from the Fed and BOE policymakers for fresh trading incentives on the spot.

Also read: BOE’s Pill: We face risks on both sides of economic outlook

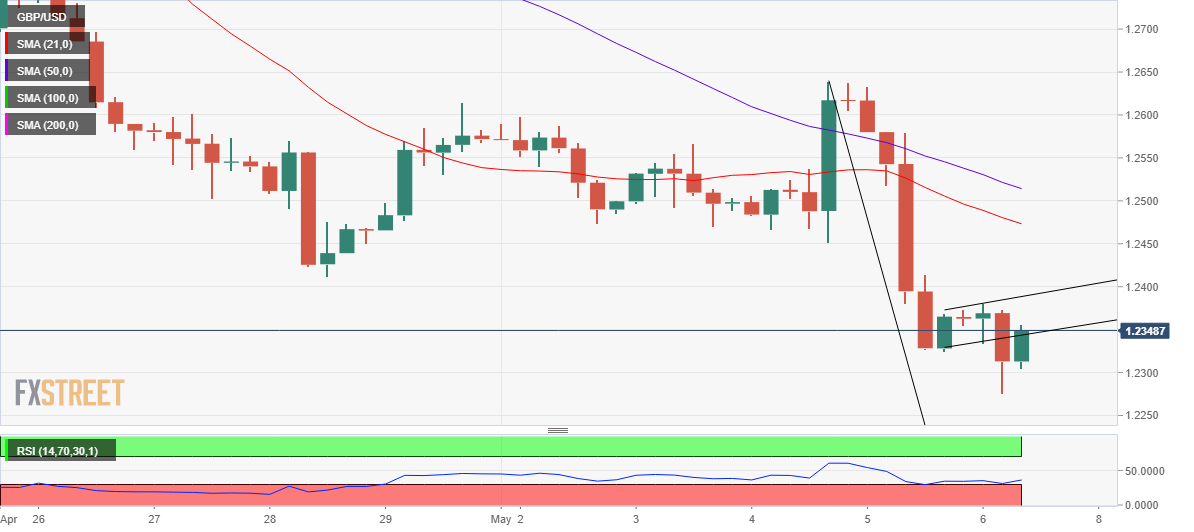
Looking at the daily chart, Thursday’s sell-off that followed the Asian consolidation carved out a bear flag formation on the four-hour chart.

The major breached the rising trendline support at 1.2340 on a 4-hour candlestick closing basis, validating the bear flag.

The further downside, therefore, opened up and the price went on to refresh 22-month lows below 1.2300.

 At the time of writing, the spot is attempting a minor comeback, although the bear flag support now resistance at 1.2340 is acting as a powerful upside barrier.

The recovery momentum will gather steam only on a sustained move above the latter, with eyes on the pattern resistance at 1.2388.

If bulls reclaim that level, then it will lead to the pattern failure, unleashing the additional recovery towards the 1.2450 psychological barrier.

Should the selling momentum resume, then bears will test the 22-month lows once again, opening floors towards 1.2250.

GBP/USD: Four-hour chart

GBP/USD: Additional technical levels

GBP/USD

Overview
Today last price1.2336
Today Daily Change-0.0021
Today Daily Change %-0.17
Today daily open1.2361
 
Trends
Daily SMA201.2806
Daily SMA501.3024
Daily SMA1001.3271
Daily SMA2001.3445
 
Levels
Previous Daily High1.2636
Previous Daily Low1.2325
Previous Weekly High1.2842
Previous Weekly Low1.2411
Previous Monthly High1.3167
Previous Monthly Low1.2411
Daily Fibonacci 38.2%1.2444
Daily Fibonacci 61.8%1.2517
Daily Pivot Point S11.2245
Daily Pivot Point S21.2129
Daily Pivot Point S31.1934
Daily Pivot Point R11.2556
Daily Pivot Point R21.2752
Daily Pivot Point R31.2868

Author

Dhwani Mehta

Dhwani Mehta

FXStreet

Residing in Mumbai (India), Dhwani is a Senior Analyst and Manager of the Asian session at FXStreet. She has over 10 years of experience in analyzing and covering the global financial markets, with specialization in Forex and commodities markets.

More from Dhwani Mehta
Share:

Editor's Picks

EUR/USD slumps below 1.1750 as USD benefits from risk-aversion

EUR/USD comes under renewed bearish pressure in the European session and trades below 1.1750 following a recovery attempt earlier in the day. The US Dollar gathers strength and weighs on the pair as investors seek refuge in the wake of Israel and the United States' joint attack on Iran.

GBP/USD targets 1.3500 barrier near moving averages

GBP/USD rebounds from the daily losses, trading around 1.3450 during the Asian hours on Monday. The technical analysis of the daily chart indicates an ongoing bearish bias, as the pair trades within a descending channel pattern.

Gold surges on safe-haven demand, rises above $5,400

Gold benefits from intense risk-aversion on Monday and climbs above $5,400, setting a fresh monthly-high in the process. Tensions in the Middle East remain high as Israel and Hezbollah continue to exchange strikes following the US-Israel joint attack on Iran over the weekend.

Bitcoin, Ethereum and Ripple under pressure as key supports face breakdown risk

Bitcoin, Ethereum, and Ripple prices trade on the back foot at the start of this week on Monday, after extending losses in the previous week. BTC is on the brink of a breakdown, ETH is capped below key resistance, and XRP risks a crack of the trendline.

The market is paying for insurance, not apocalypse

As expected, this morning felt less like a Monday market open and more like a fire drill. Futures screens flickered red. S&P contracts down almost 1%. Nasdaq off 1.2%. Brent leaped 13% through $80. Gold rose 1.6% toward $5350 before paring some gains. The dollar is strutting mildly. The Swiss franc is quietly doing what it always does in a storm, catching some safe-haven flows.

Pi Network Price Forecast: Core team offloads supply, weighing on PI recovery

Pi Network  hovers below $0.1700, broadly steady at press time on Monday, attempting a recovery after a 2% loss the previous day. Sunday’s decline aligned with nearly 49 million PI tokens offloaded by the Pi Foundation, implying a spike in supply pressure that capped the prevailing four-day recovery.