GBP/USD Price Analysis: Rises to 1.2700 nearing 14-day EMA
- GBP/USD extends gains to test 14-day EMA at 1.2704 level.
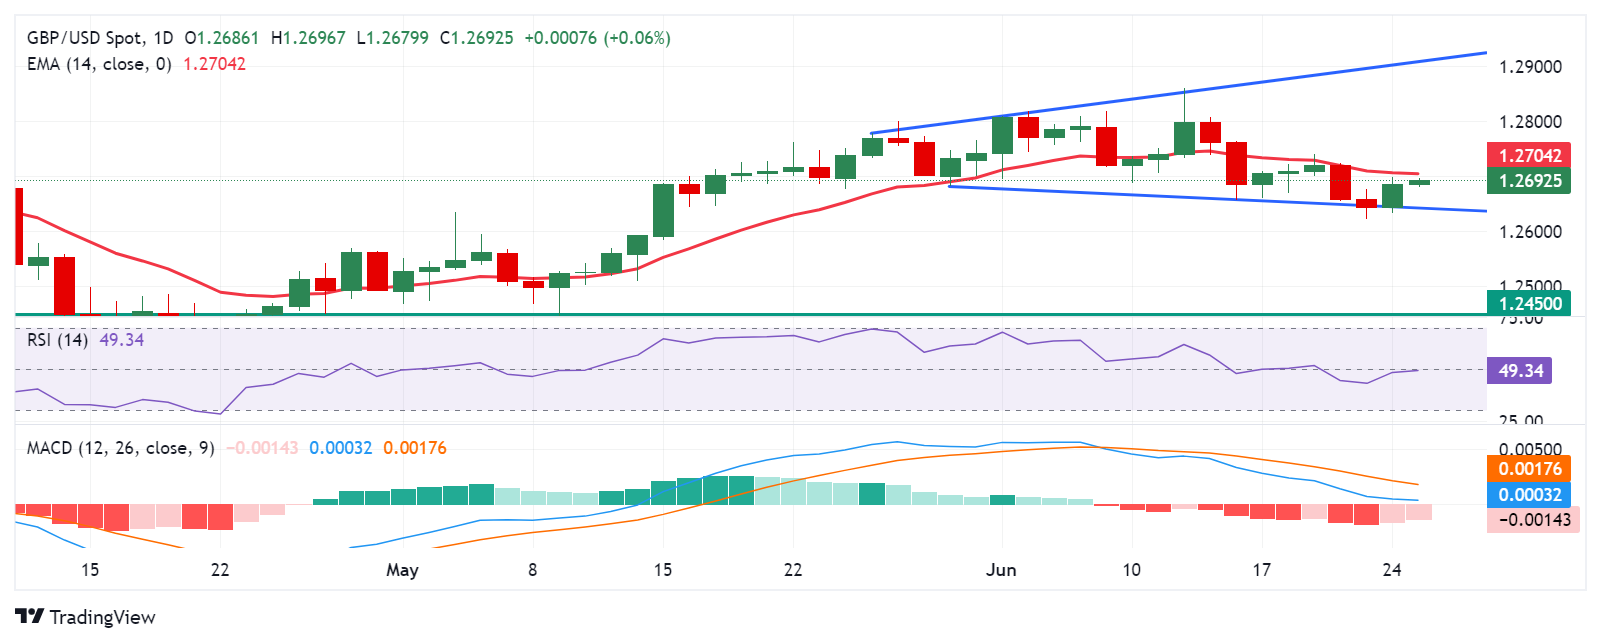
- A broadening bottom pattern on a daily chart suggests a potential correction before moving lower.
- The lower boundary of the broadening bottom pattern around the level of 1.2640 could act as a key support.

GBP/USD extends gains for the second successive session, trading around 1.2700 during Asian hours on Tuesday. Analysis of the daily chart shows a broadening bottom pattern in price action, representing increasing volatility. This chart pattern suggests a potential correction before moving lower.
The 14-day Relative Strength Index (RSI) is positioned below the 50 level, indicating a bearish bias. Furthermore, the Moving Average Convergence Divergence (MACD) momentum indicator also suggests a downward trend, as the MACD line is above the centerline but diverges below the signal line. Breaking below the centerline may strengthen the downward trend.
To the downside, the GBP/USD pair may find key support at the bottom wedge of the broadening bottom pattern around the level of 1.2640. A break below this level could exert pressure on the pair to navigate the vicinity of the throwback support at 1.2450.
In terms of resistance, the immediate barrier appears at the 14-day Exponential Moving Average (EMA) at the 1.2704 level. A breakthrough above this level could propel the GBP/USD pair toward testing the top wedge of the broadening bottom pattern around 1.2900.
GBP/USD: Daily Chart
Author

Akhtar Faruqui
FXStreet
Akhtar Faruqui is a Forex Analyst based in New Delhi, India. With a keen eye for market trends and a passion for dissecting complex financial dynamics, he is dedicated to delivering accurate and insightful Forex news and analysis.


