GBP/USD Price Analysis: Remain bearish despite bouncing off weekly lows
- GBP/USD climbs to 1.2652, up 0.25%, remaining under the 1.2703 weekly high.
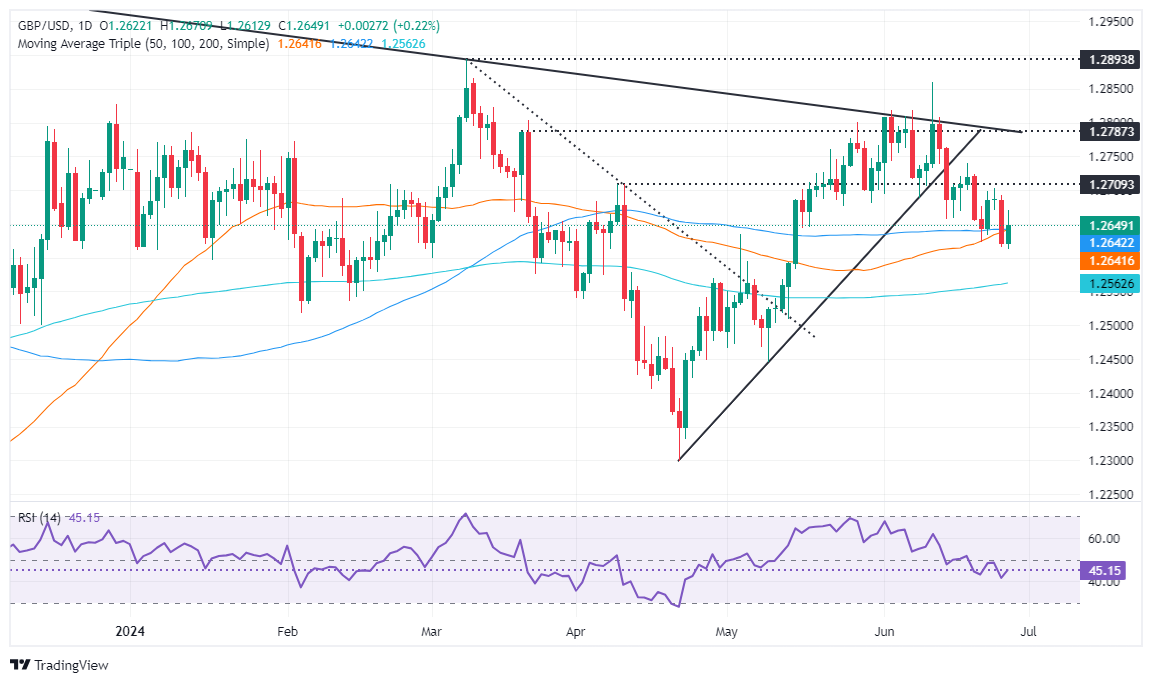
- Technical stance neutral; daily MAs range between 1.2641 and 1.2557.
- 'Evening star' pattern and bearish RSI suggest potential drop; support at 1.2641/39 (100 & 50-DMAs), 1.2600, 1.2555 (200-DMA).
- For bullish move, GBP/USD must surpass 1.2700 and tackle resistance at 1.2730/40.

The Pound Sterling gathers some steam versus the Greenback, yet it remains trading below the weekly highs of 1.2703 as investors await the US Personal Consumption Expenditure (PCE) Price Index release, along with fears of the upcoming general election in the UK. The GBP/USD trades at 1.2652, up 0.25%.
GBP/USD Price Analysis: Technical outlook
The GBP/USD is neutral biased further confirmed by almost fla daily moving averages (DMAs) trapped within the 1.2641-1.2557 range. The formation of an ‘evening star’ kept traders from reclaiming 1.2700, exacerbated Cable’s fall to a six-week low of 1.2612.
Momentum favors sellers as depicted by the Relative Strength Index (RSI) standing at bearish territory; therefore, the GBP/USD path of least resistance is tilted to the downside.
First support would be the confluence of the 100 and 50-DMAs at around 1.2641/39, followed by the 1.2600 psychological figure. Once surpassed, the next demand zone to challenge would be the 200-DMA at 1.2555.
For a bullish continuation, traders must claim 1.2700 and clear a previous support trendline turned resistance at around 1.2730/40.
GBP/USD Price Action – Daily Chart
Pound Sterling FAQs
The Pound Sterling (GBP) is the oldest currency in the world (886 AD) and the official currency of the United Kingdom. It is the fourth most traded unit for foreign exchange (FX) in the world, accounting for 12% of all transactions, averaging $630 billion a day, according to 2022 data. Its key trading pairs are GBP/USD, aka ‘Cable’, which accounts for 11% of FX, GBP/JPY, or the ‘Dragon’ as it is known by traders (3%), and EUR/GBP (2%). The Pound Sterling is issued by the Bank of England (BoE).
The single most important factor influencing the value of the Pound Sterling is monetary policy decided by the Bank of England. The BoE bases its decisions on whether it has achieved its primary goal of “price stability” – a steady inflation rate of around 2%. Its primary tool for achieving this is the adjustment of interest rates. When inflation is too high, the BoE will try to rein it in by raising interest rates, making it more expensive for people and businesses to access credit. This is generally positive for GBP, as higher interest rates make the UK a more attractive place for global investors to park their money. When inflation falls too low it is a sign economic growth is slowing. In this scenario, the BoE will consider lowering interest rates to cheapen credit so businesses will borrow more to invest in growth-generating projects.
Data releases gauge the health of the economy and can impact the value of the Pound Sterling. Indicators such as GDP, Manufacturing and Services PMIs, and employment can all influence the direction of the GBP. A strong economy is good for Sterling. Not only does it attract more foreign investment but it may encourage the BoE to put up interest rates, which will directly strengthen GBP. Otherwise, if economic data is weak, the Pound Sterling is likely to fall.
Another significant data release for the Pound Sterling is the Trade Balance. This indicator measures the difference between what a country earns from its exports and what it spends on imports over a given period. If a country produces highly sought-after exports, its currency will benefit purely from the extra demand created from foreign buyers seeking to purchase these goods. Therefore, a positive net Trade Balance strengthens a currency and vice versa for a negative balance.
Author

Christian Borjon Valencia
FXStreet
Markets analyst, news editor, and trading instructor with over 14 years of experience across FX, commodities, US equity indices, and global macro markets.


