|

GBP/USD Price Analysis: Pound off session highs, holds above 1.3000 level

  • GBP/USD is gaining steam above the 1.3000 figure.
  • The level to beat for buyers is the 1.3080 resistance. 
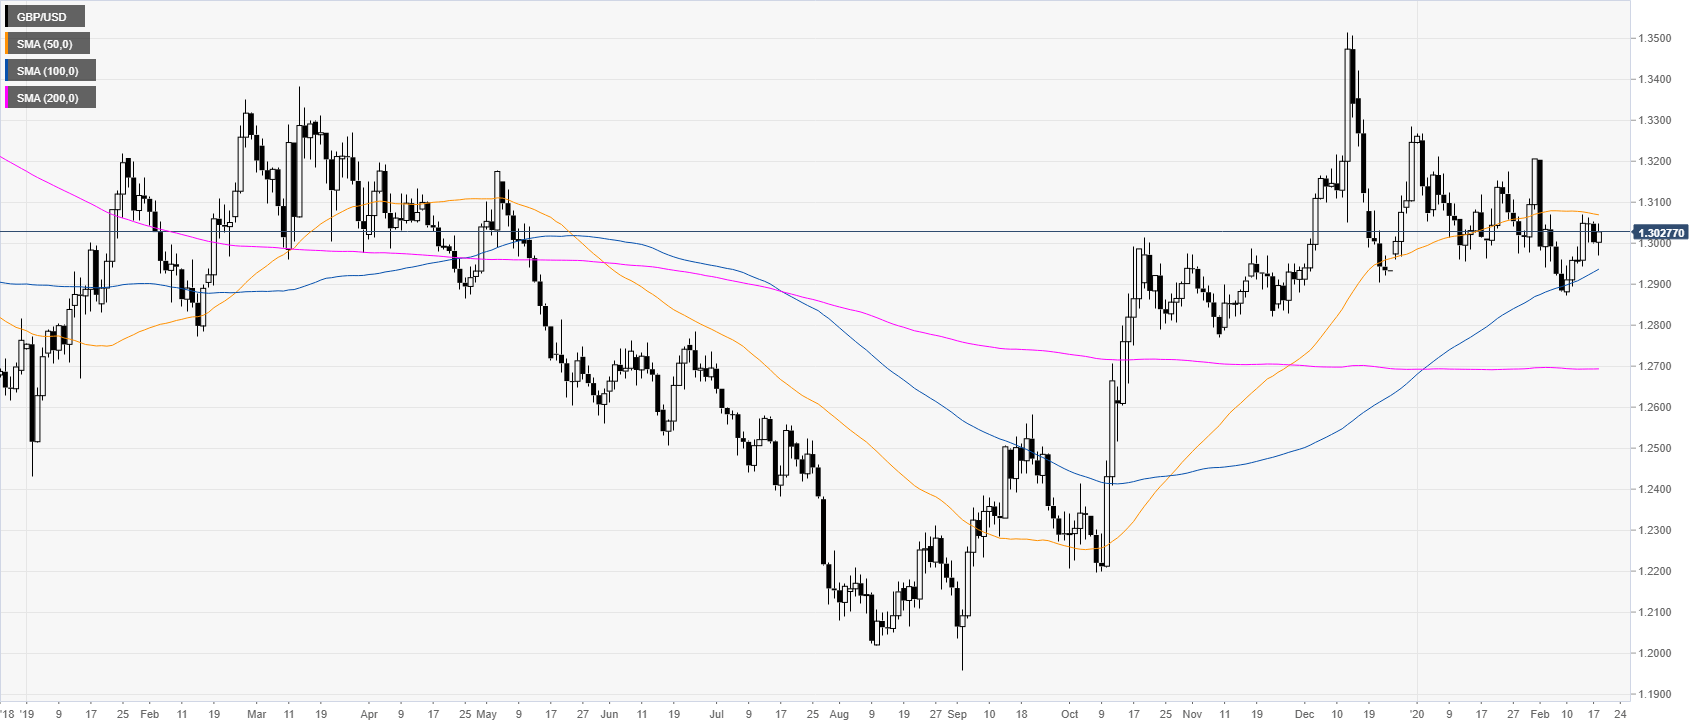
 

GBP/USD daily chart 

 
Following the October and December bull-run, pound/dollar is trading in a rectangle consolidation above the 100/200-day simple moving averages (SMAs). The spot is trading below the 1.3100 and 50 SMA.
 

GBP/USD four-hour chart

 
The pound is rebounding from the 1.3000 support while challenging the 200 SMAs on the four-hour chart. Bulls seem unwilling to let go, however they need to overcome the 1.3080 level to reach the upper side of the range near 1.3125 and 1.3160 levels. Supports are likely located near 1.3000, 1.2958 and 1.2931 level, according to the Technical Confluences Indicator.   


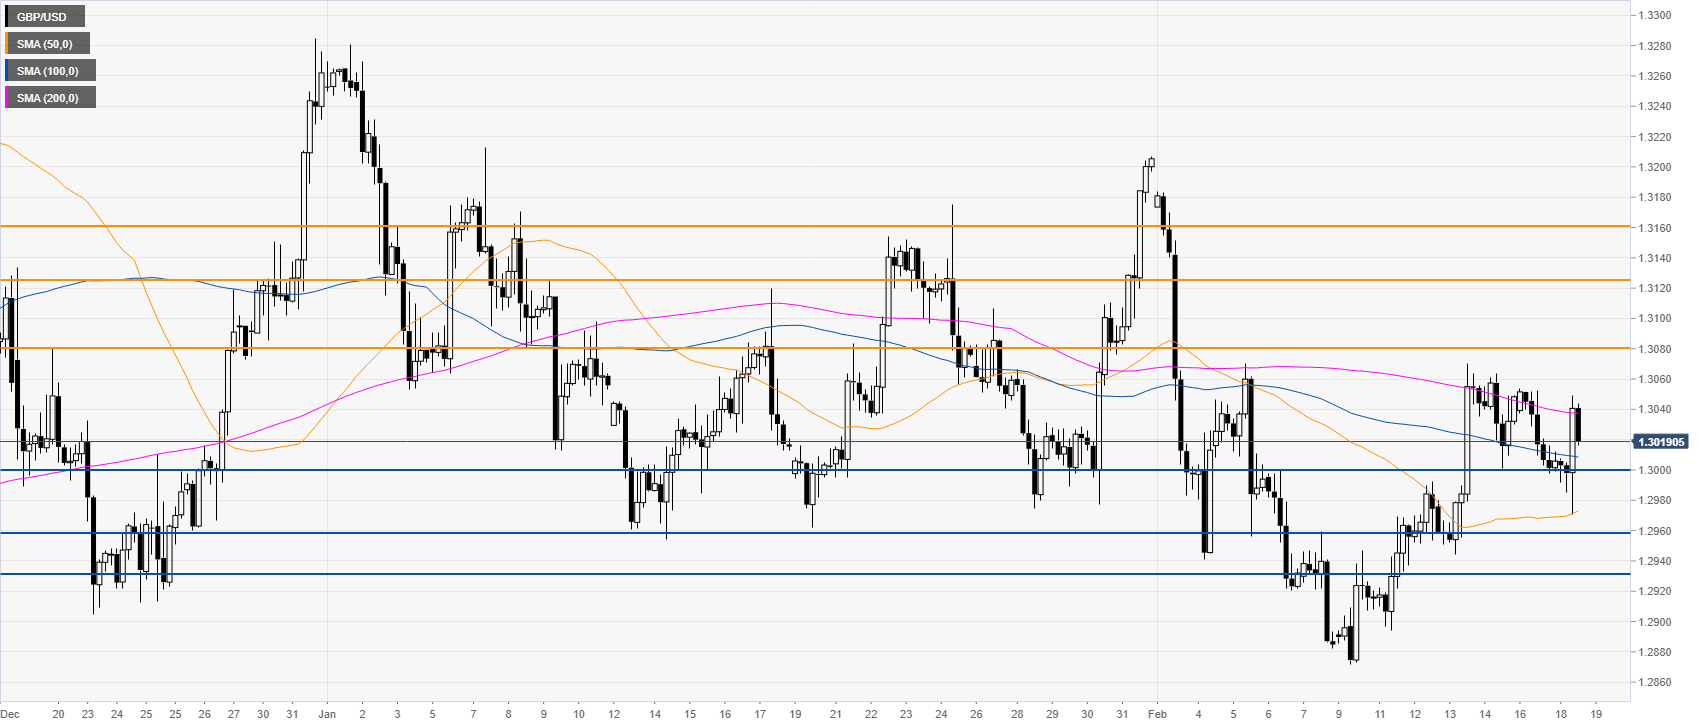
Resistance: 1.3080, 1.3125, 1.3160
Support: 1.3000, 1.2958, 1.2931   
 

Additional key levels

GBP/USD

Overview
Today last price1.302
Today Daily Change0.0018
Today Daily Change %0.14
Today daily open1.3002
 
Trends
Daily SMA201.3026
Daily SMA501.3068
Daily SMA1001.2936
Daily SMA2001.2693
 
Levels
Previous Daily High1.3054
Previous Daily Low1.2998
Previous Weekly High1.307
Previous Weekly Low1.2872
Previous Monthly High1.3281
Previous Monthly Low1.2954
Daily Fibonacci 38.2%1.3019
Daily Fibonacci 61.8%1.3033
Daily Pivot Point S11.2982
Daily Pivot Point S21.2962
Daily Pivot Point S31.2926
Daily Pivot Point R11.3038
Daily Pivot Point R21.3074
Daily Pivot Point R31.3094

Author

Flavio Tosti

Flavio Tosti

Independent Analyst


More from Flavio Tosti
Share:

Editor's Picks

EUR/USD: Bears retain control below 1.1780-1.1770 confluence breakpoint

The EUR/USD pair remains on the back foot through the Asian session on Friday and currently trades just above mid-1.1700s, well within striking distance of a nearly one-month low set the previous day.

GBP/USD seems vulnerable near one-month low as traders await US data

The GBP/USD pair prolongs its weekly downtrend for the fifth consecutive day on Friday and slides back closer to a nearly one-month low, touched the previous day. Spot prices trade below mid-1.3400s during the Asian session on Friday and seem vulnerable to slide further as traders now look to important US macro data for a fresh impetus.

Gold eyes next breakout on US GDP, PCE inflation data

Gold sticks to recent gains around the $5,000-mark early Friday, biding time before the high-impact US macro events. The focus is now on the US fourth-quarter Gross Domestic Product, core Personal Consumption Expenditures Price Index and the Supreme Court’s ruling on President Donald Trump’s tariffs.

Bitcoin, Ethereum and Ripple remain range-bound as breakdown risks rise

Bitcoin, Ethereum, and Ripple are trading sideways within consolidation ranges on Friday, signaling a lack of directional bias in the broader crypto market. BTC rebounded from key support, and ETH is nearing the lower consolidation boundary, while XRP is holding at its lower trendline boundary. 

Hawkish Fed minutes and a market finding its footing

It was green across the board for US Stock market indexes at the close on Wednesday, with most S&P 500 names ending higher, adding 38 points (0.6%) to 6,881 overall. At the GICS sector level, energy led gains, followed by technology and consumer discretionary, while utilities and real estate posted the largest losses.

Official Trump price approaches breakout with mixed signals from traders

Official Trump (TRUMP) is trading at $3.50 at the time of writing, approaching its upper consolidation range. A breakout from this range could open the door for an upside move. On-chain data shows market indecision, with balanced flows between bulls and bears, signaling a lack of clear directional bias.