|
GBP/USD Price Analysis: Pound easing from weekly high, trades above 1.3000 figure
- GBP/USD is reversing from multi-week lows and challenges the 1.3000 figure.
- The levels to beat for bulls is the 1.3038 level.
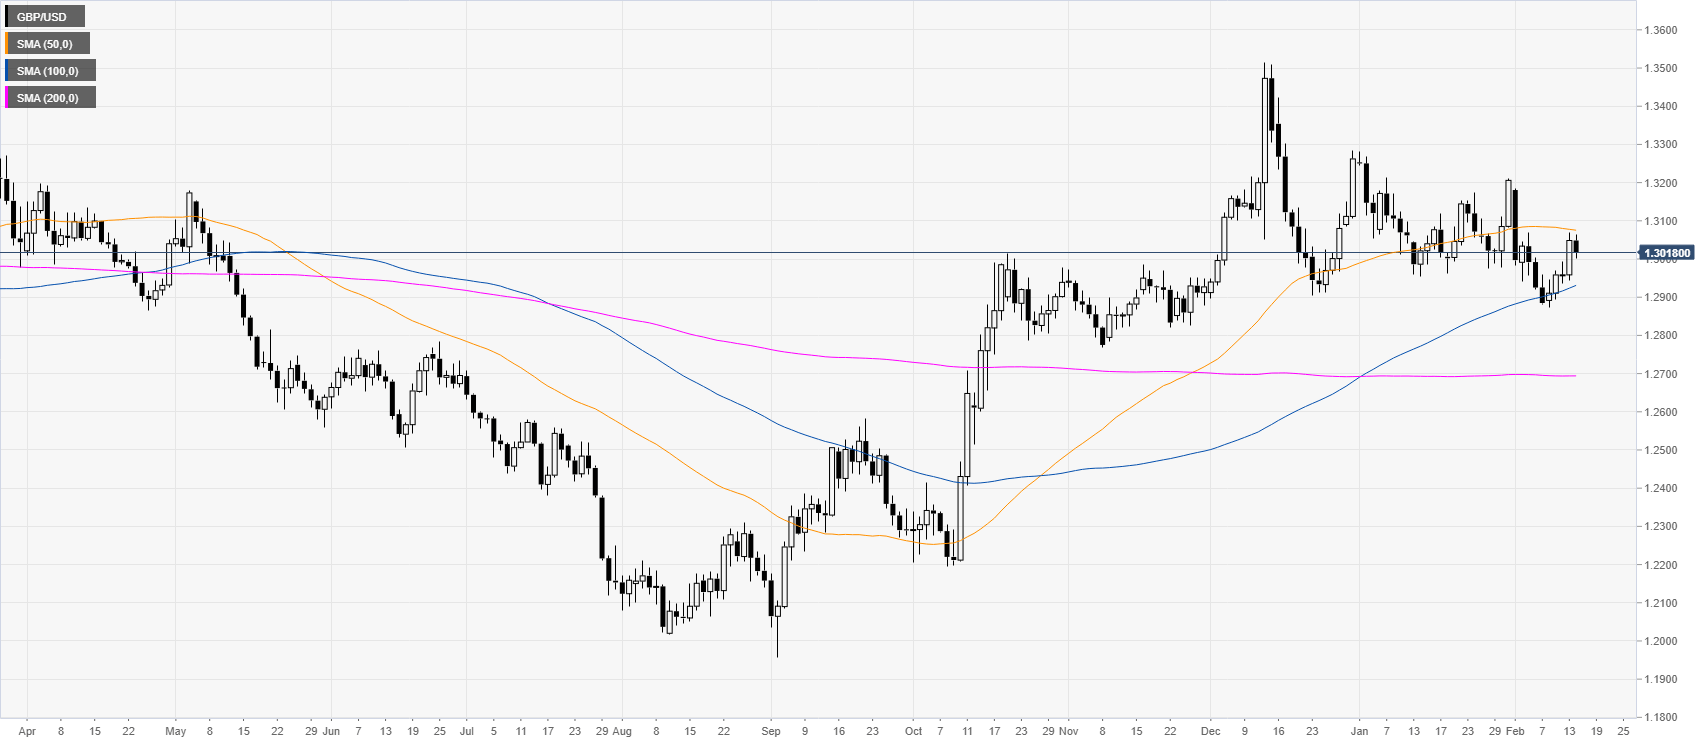
GBP/USD daily chart
Following the October and December bull-run, GBP/USD is trading in a rectangle consolidation above its 100/200-day simple moving averages (SMAs). The spot is easing below the 1.3100 figure and the 50 SMA.
GBP/USD four-hour chart
The pound is reversing up from multi-week lows as GBP/USD spot is challenging the 1.3000 figure. The market is easing from the weekly high however, bulls are likely back in control and the spot should attempt to break above the 1.3038 resistance to reach the 1.3079 and 1.3160 resistances. Support is seen near the 1.299 and 1.2957 price levels, according to the Technical Confluences Indicator.
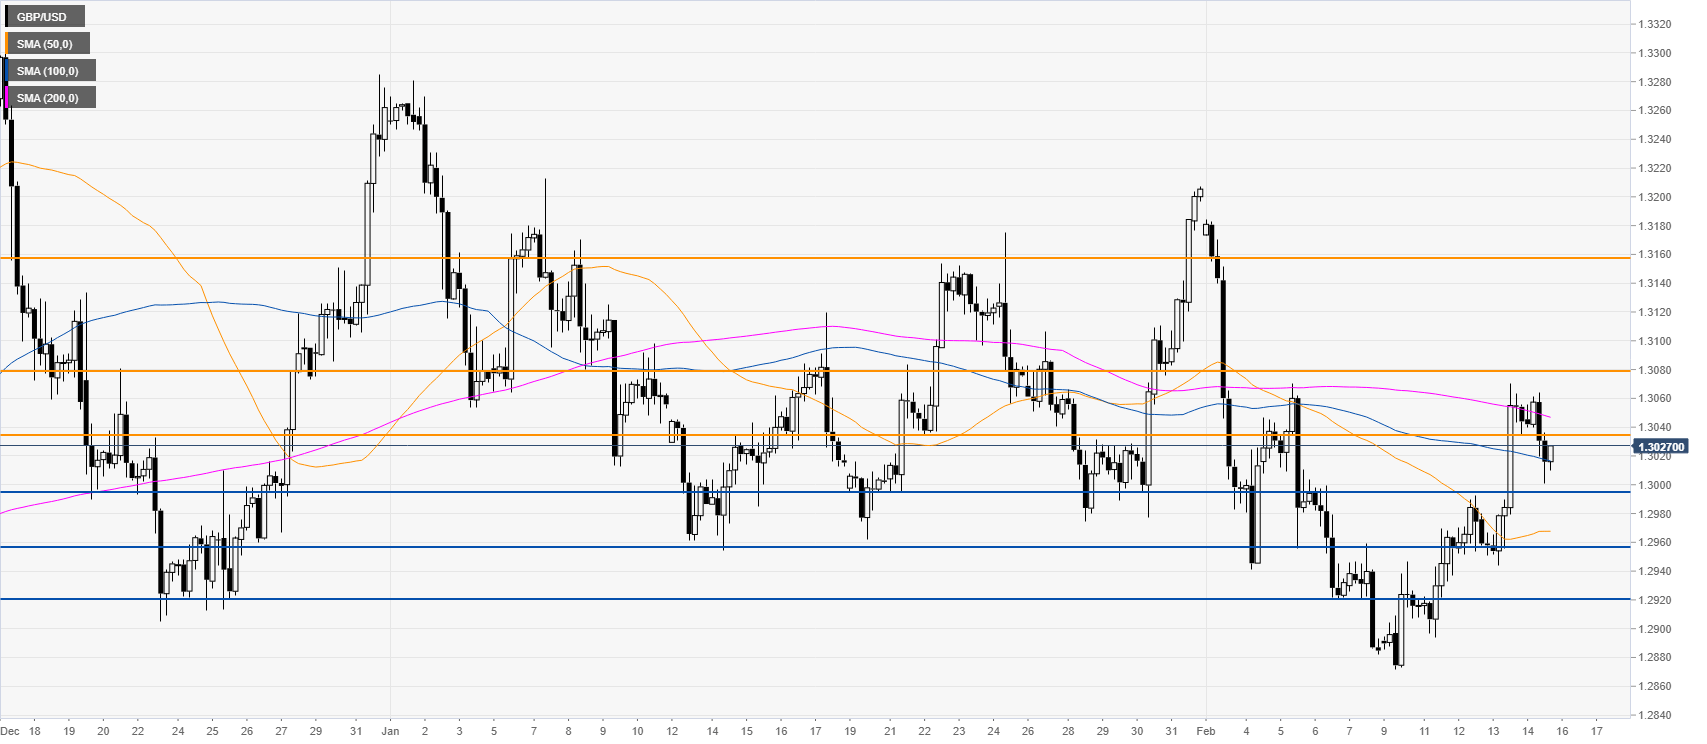
Resistance: 1.3038, 1.3079, 1.3160
Support: 1.2998, 1.2957, 1.2920
Additional key levels
Author

Flavio Tosti
Independent Analyst
More from Flavio Tosti


