|

GBP/USD Price Analysis: Pound down, approaches 1.2400 figure vs. US dollar

  • GBP/USD is pulling back down towards the 1.2400 figure. 
  • GBP/USD faces an important test at the 1.2400 level. 
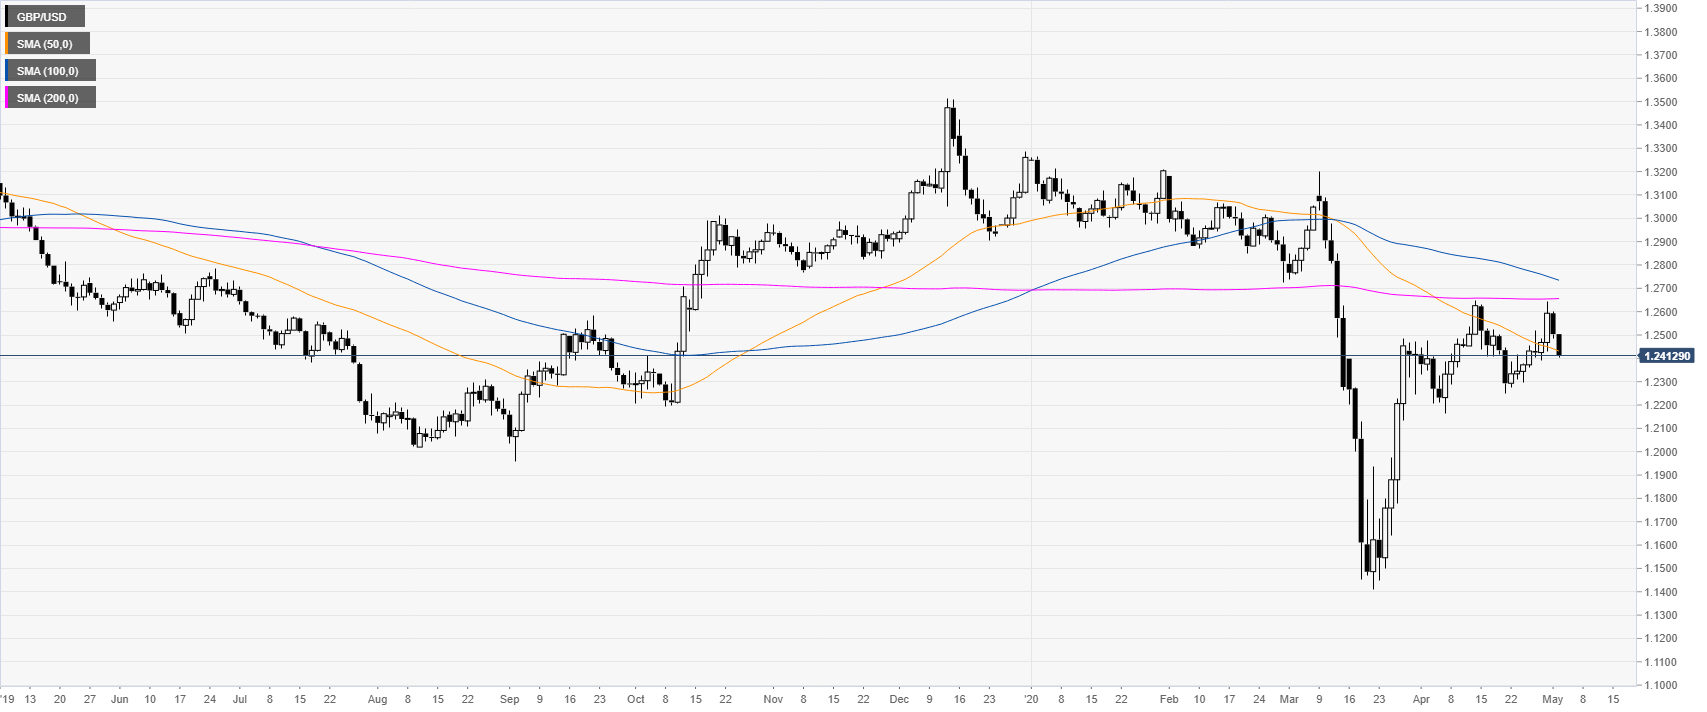
 

GBP/USD daily chart

 
GBP/USD is consolidating in the 1.2200/1.2600 zone while trading below its main SMAs on the daily chart. An uptick on the greenback is weighing on the GBP/USD currency pair.
 

GBP/USD four-hour chart

 
GBP/USD correction down is approaching the 1.2400 figure while the spot is trading below the 50/100 SMAs but still above the 200 SMA on the four-hour chart. The bulls will attempt to support the market near current levels in order to regain the 1.2500 figure one more time. However, a daily close below the 1.2400 figure can lead to further weakness towards the 1.2300 level. Resistance should emerge near the 1.2500 figure. 


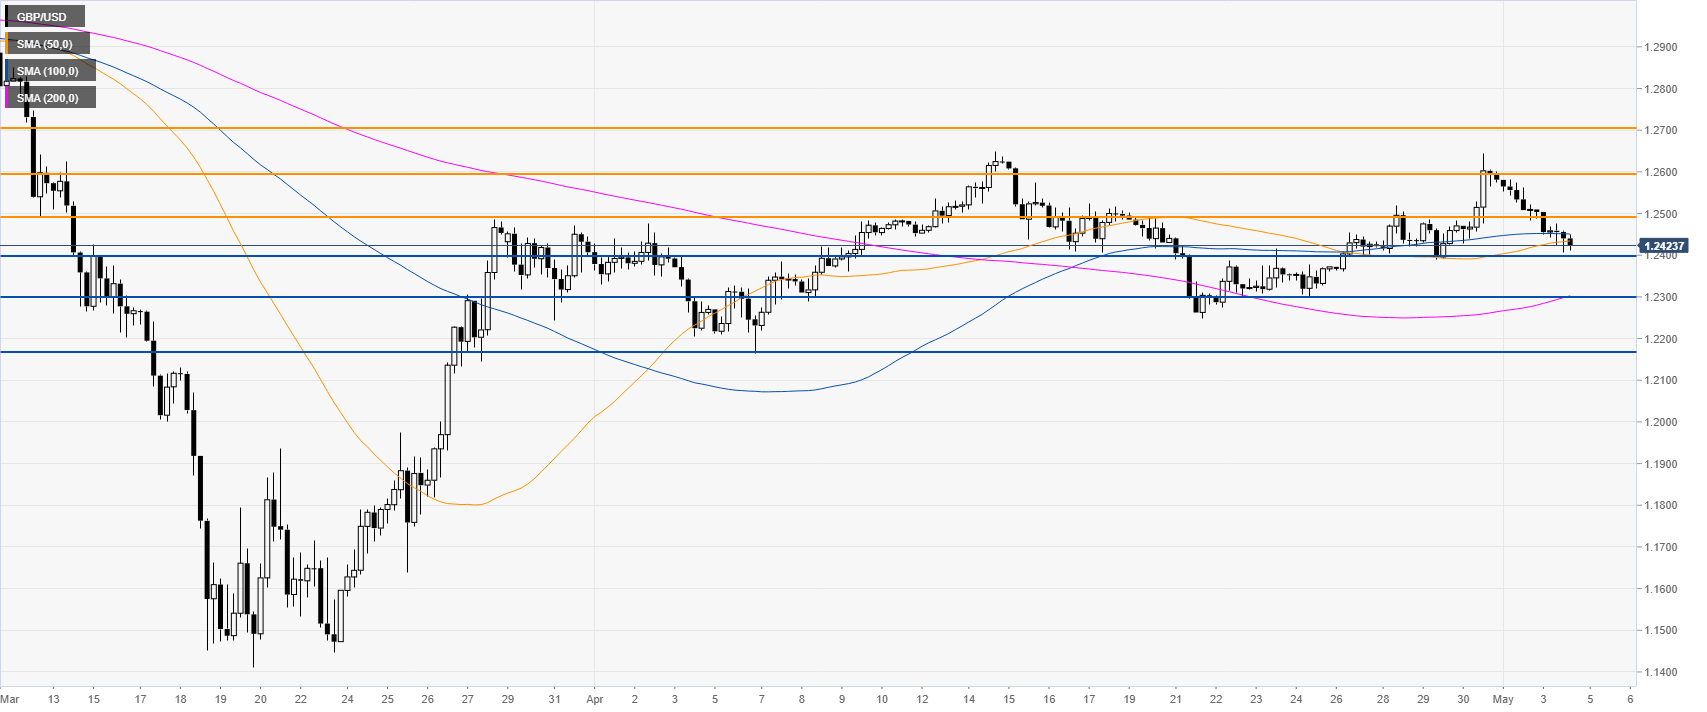
Resistance: 1.2500, 1.2600, 1.2700
Support: 1.2400, 1.2300, 1.2165


Additional key levels

GBP/USD

Overview
Today last price1.2504
Today Daily Change0.0000
Today Daily Change %0.00
Today daily open1.2504
 
Trends
Daily SMA201.2433
Daily SMA501.2442
Daily SMA1001.2744
Daily SMA2001.2654
 
Levels
Previous Daily High1.2601
Previous Daily Low1.2483
Previous Weekly High1.2644
Previous Weekly Low1.236
Previous Monthly High1.2648
Previous Monthly Low1.2165
Daily Fibonacci 38.2%1.2528
Daily Fibonacci 61.8%1.2556
Daily Pivot Point S11.2458
Daily Pivot Point S21.2412
Daily Pivot Point S31.234
Daily Pivot Point R11.2575
Daily Pivot Point R21.2647
Daily Pivot Point R31.2693

Author

Flavio Tosti

Flavio Tosti

Independent Analyst


More from Flavio Tosti
Share:

Editor's Picks

EUR/USD accelerates losses, focus is on 1.1800

EUR/USD’s selling pressure is gathering pace now, opening the door to a potential test of the key 1.1800 region sooner rather than later. The pair’s pullback comes on the back of marked gains in the US Dollar following US data releases and the publication of the FOMC Minutes later in the day.

GBP/USD turns negative near 1.3540

GBP/USD reverses its initial upside momentum and is now adding to previous declines, revisiting at the same time the 1.3540 region on Wednesday. Cable’s downtick comes on the back of decent gains in the Greenback and easing UK inflation figures, which seem to have reinforced the case for a BoE rate cut in March.

Gold picks pace, flirts with $5,000

Gold is back on the front foot on Wednesday, shaking off part of the early week softness and pushing higher towards the key $5,000 mark per troy ounce. The move comes ahead of the FOMC Minutes and is unfolding despite an intense rebound in the US Dollar.

Fed Minutes to shed light on January hold decision amid hawkish rate outlook

The Minutes of the Fed’s January 27-28 monetary policy meeting will be published today. Details of discussions on the decision to leave the policy rate unchanged will be scrutinized by investors.

Mixed UK inflation data no gamechanger for the Bank of England

Food inflation plunged in January, but service sector price pressure is proving stickier. We continue to expect Bank of England rate cuts in March and June. The latest UK inflation read is a mixed bag for the Bank of England, but we doubt it drastically changes the odds of a March rate cut.

Sui extends sideways action ahead of Grayscale’s GSUI ETF launch

Sui is extending its downtrend for the second consecutive day, trading at 0.95 at the time of writing on Wednesday. The Layer-1 token is down over 16% in February and approximately 34% from the start of the year, aligning with the overall bearish sentiment across the crypto market.