|

GBP/USD Price Analysis: Portrays falling wedge on hourly chart below 1.2200

  • GBP/SD extends recoveries from 1.2162 to intraday high of 1.2191.
  • 200-HMA adds to the upside resistance.
  • Bears can refresh monthly low amid a gradual weakening.

GBP/USD rises to 1.2191, up 0.15% on a day, during Monday’s Asian session. In doing so, the Cable pair extends its recoveries from Friday’s low of 1.2162 while staying inside a bullish chart formation.

Considering the pair’s sustained trading below 200-HMA, bulls are less likely to enter immediately on the upside break of falling wedge resistance, at 1.2200 now.

However, a successful break of 1.2215, comprising 200-HMA, could propel the quote towards the last weekly top near 1.2300.

Meanwhile, a downside break below the formation’s support line of 1.2148 could challenge the monthly low near 1.2075.

Though, the pair’s extended fall below 1.2075 might not hesitate to challenge 1.2000 round-figures.

GBP/USD hourly chart
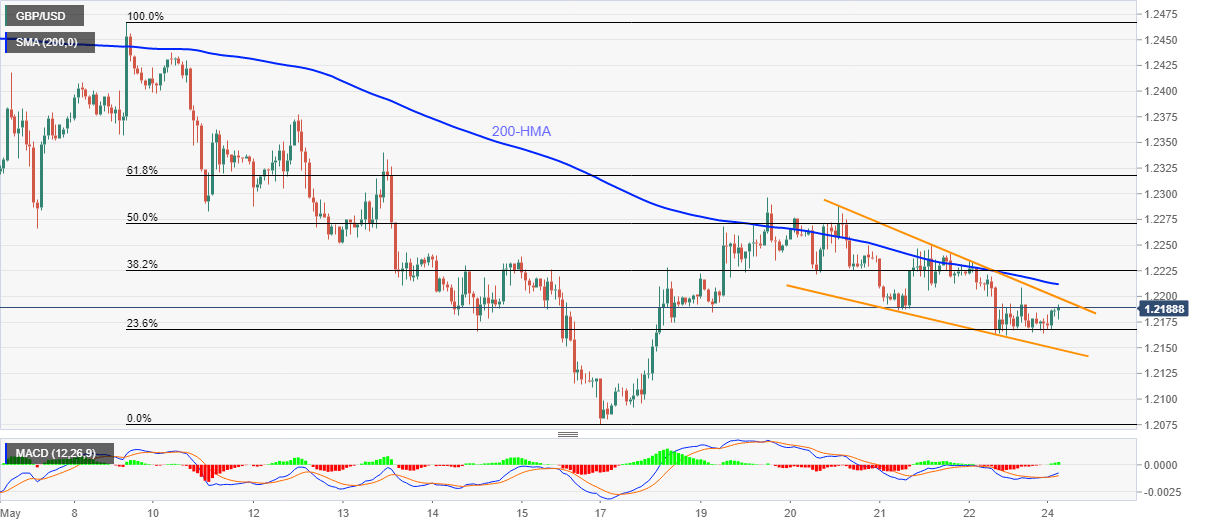
Trend: Bearish

Additional important levels

Overview
Today last price1.2188
Today Daily Change14 pips
Today Daily Change %0.11%
Today daily open1.2174
 
Trends
Daily SMA201.2334
Daily SMA501.2274
Daily SMA1001.2623
Daily SMA2001.2666
 
Levels
Previous Daily High1.2234
Previous Daily Low1.2162
Previous Weekly High1.2296
Previous Weekly Low1.2076
Previous Monthly High1.2648
Previous Monthly Low1.2165
Daily Fibonacci 38.2%1.2189
Daily Fibonacci 61.8%1.2206
Daily Pivot Point S11.2146
Daily Pivot Point S21.2118
Daily Pivot Point S31.2074
Daily Pivot Point R11.2218
Daily Pivot Point R21.2262
Daily Pivot Point R31.229

Author

Anil Panchal

Anil Panchal

FXStreet

Anil Panchal has nearly 15 years of experience in tracking financial markets. With a keen interest in macroeconomics, Anil aptly tracks global news/updates and stays well-informed about the global financial moves and their implications.

More from Anil Panchal
Share:

Editor's Picks

EUR/USD looks sidelined around 1.1850

EUR/USD remains on the back foot, extending its bearish tone and sliding towards the 1.1850 area to print fresh daily lows on Monday. The move lower comes as the US Dollar gathers modest traction, with thin liquidity and subdued volatility amplifying price swings amid the US market holiday.

GBP/USD flirts with daily lows near 1.3630

GBP/USD has quickly given back Friday’s solid gains, turning lower at the start of the week and drifting back towards the 1.3630 area. The focus now shifts squarely to Tuesday’s UK labour market report, which is likely to keep the quid firmly in the spotlight and could set the tone for Cable’s next move.

Gold loses momentum, eases below $5,000

Gold is giving back part of Friday’s sharp rebound, deflating below the key $5,000 mark per troy ounce as the new week gets underway. Modest gains in the US Dollar are keeping the metal in check, while thin trading conditions, due to the Presidents Day holiday in the US, are adding to the choppy and hesitant tone across markets.

Bitcoin consolidates as on-chain data show mixed signals

Bitcoin price has consolidated between $65,700 and $72,000 over the past nine days, with no clear directional bias. US-listed spot ETFs recorded a $359.91 million weekly outflow, marking the fourth consecutive week of withdrawals.

The week ahead: Key inflation readings and why the AI trade could be overdone

It is likely to be a quiet start to the week, with US markets closed on Monday for Presidents Day. European markets are higher across the board and gold is clinging to the $5,000 level after the tamer than expected CPI report in the US reduced haven flows to precious metals.

XRP steadies in narrow range as fund inflows, futures interest rise

Ripple is trading in a narrow range between $1.45 (immediate support) and $1.50 (resistance) at the time of writing on Monday. The remittance token extended its recovery last week, peaking at $1.67 on Sunday from the weekly open at $1.43.