|

GBP/USD Price Analysis: Plummets and shift bearish, dives below 1.2500

  • GBP/USD falls sharply, influenced by a move towards safer assets and a strengthening US Dollar.
  • Technical analysis indicates a shift to bearish territory after dropping below the 200-day moving average.
  • Recovery targets include reclaiming 1.2500, with resistance at the 200-day DMA.

The British Pound plunged against the US Dollar late in the North American session, down 0.74%, and trades at 1.2445 after hitting a daily high of 1.2559. Risk aversion triggered a flight to safety, a headwind for the Pound Sterling even though UK GDP figures were solid.

GBP/USD Price Analysis: Technical outlook

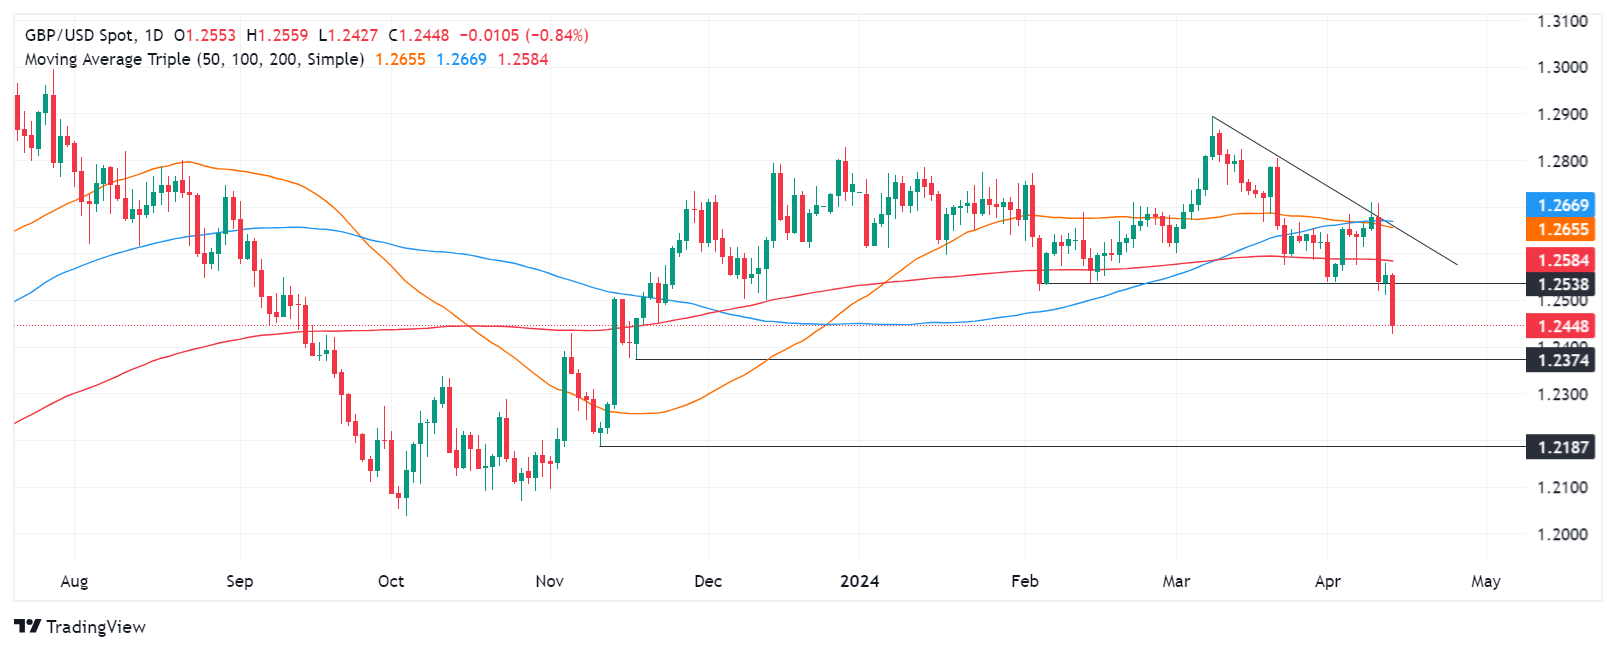
From a technical perspective, the GBP/USD shifted bearish as it achieved a successive series of lower highs and lows while breaching key support levels. On its way south, the pair cleared the 200-day moving average (DMA) at 1.2584, which opened the door to a tumble below 1.2500.

For a bearish continuation, the GBP/USD needs to clear the 1.2400 mark. A breach of the latter will expose the November 17, 2023, low of 1.2374, followed by the 1.2300 mark.

On the other hand, if buyers lift the GBP/USD past the 1.2500, that could pave the way for further gains. The next resistance would be the 200-day moving average (DMA) at 1.2584, ahead of 1.2600.

As the GBP/USD dropped below key support levels and achieved

GBP/USD Price Action – Daily Chart
GBP/USD

Overview
Today last price1.2447
Today Daily Change-0.0106
Today Daily Change %-0.84
Today daily open1.2553
 
Trends
Daily SMA201.2644
Daily SMA501.2659
Daily SMA1001.267
Daily SMA2001.2586
 
Levels
Previous Daily High1.2579
Previous Daily Low1.2511
Previous Weekly High1.2684
Previous Weekly Low1.2539
Previous Monthly High1.2894
Previous Monthly Low1.2575
Daily Fibonacci 38.2%1.2553
Daily Fibonacci 61.8%1.2537
Daily Pivot Point S11.2516
Daily Pivot Point S21.248
Daily Pivot Point S31.2448
Daily Pivot Point R11.2584
Daily Pivot Point R21.2615
Daily Pivot Point R31.2652

Author

Christian Borjon Valencia

Markets analyst, news editor, and trading instructor with over 14 years of experience across FX, commodities, US equity indices, and global macro markets.


More from Christian Borjon Valencia
Share:

Editor's Picks

AUD/USD treads water above 0.7000 ahead of the RBA

AUD/USD alternates gains with losses just above the 0.7000 yardstick ahead of the opening bell in Asia on Tuesday. The pair’s decline follows the Greenback’s decent advance in a context of heightened geopolitical effervescence. Moving forward, the RBA is expected to hike its OCR to 4.60%.

USD/JPY climbs back toward 158.00 after BoJ minutes amid firm USD

USD/JPY finds dip-buyers and reverses part of Friday's slide driven by speculation that authorities will step in again to prop up the Japanese Yen. However, the BoJ's dovish Minutes cap the JPY. Meanwhile, the US Dollar regains traction as the US-Iran standoff supports crude oil prices, fueling inflation fears and reaffirming bets for an October Fed rate hike. This further supports the pair, driving it back toward 158.00.

Gold tumbles further; focus shifts to $4,100

Gold kicks in the week on the back foot, selling off to the vicinity of the $4,100 mark per troy ounce, levels last traded back in early August. The resurgence of geopolitical concerns in combination with the firmer US Dollar and rising US Treasury yields keep the yellow metal under heavy pressure on Monday.

Strategy buys 1,665 Bitcoin amid renewed geopolitical tensions
Bitcoin (BTC) dropped below $84,000 on Monday as Strategy (MSTR) announced a fresh treasury purchase of $143 million last week, boosting its holdings to 847,666 BTC. The company purchased 1,665 BTC for roughly $142.7 million, according to a filing with the Securities and Exchange Commission (SEC) on Monday.
The week ahead: A key moment for the global economy as threats rise

UK diesel hits a record, as economic concerns rise. The market expects an aggressive Fed rate hiking cycle, but is it necessary? Oil supply concerns ease, even as oil prices rise. What’s next for the AI trade.

Fed vs BoJ: Both hiked. The market only believes one of them – and the chart shows which

The Fed and the BoJ have just done something remarkably similar. Both central banks raised interest rates by 25 bps last week, both are confronting inflation risks, and both signal that future decisions will depend on incoming economic data.














