|

GBP/USD Price Analysis: Monday’s bullish pin bar keeps buyers hopeful

  • GBP/USD extends the previous day’s recovery moves from 1.3530.
  • Bullish candlestick formation, sustained trading above 21-day SMA favor buyers.
  • Monthly resistance line adds to the upside barriers.

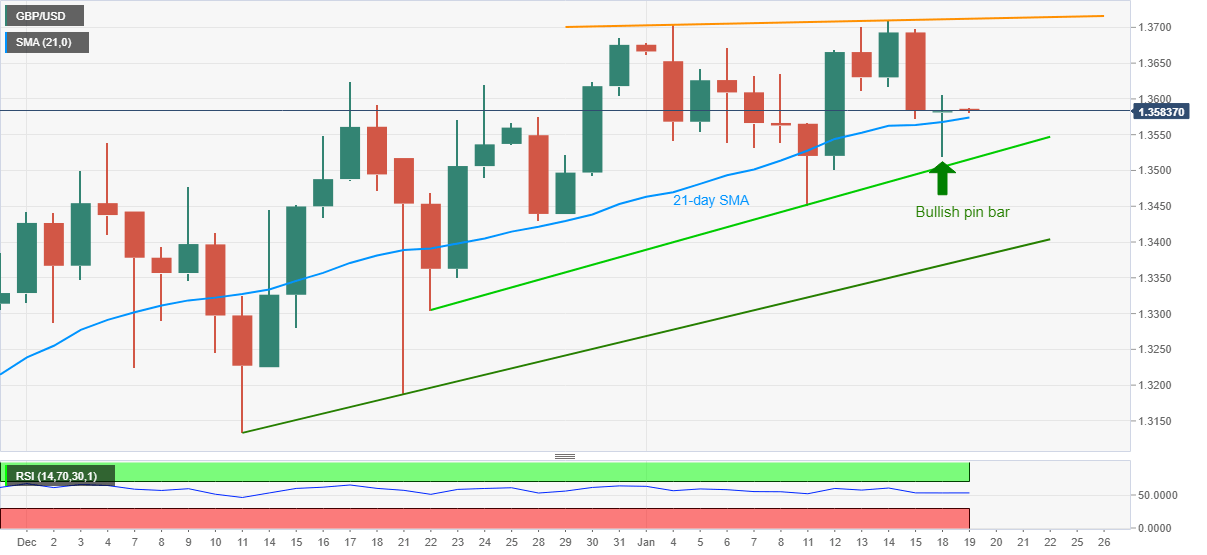
GBP/USD picks up bids around 1.3590 amid the initial Asian trading session on Tuesday. In doing so, the Cable justifies its bounce off 21-day SMA and a bullish pin bar candlestick pattern on the daily (1D) chart.

With the normal RSI conditions joining the aforementioned price-positive catalysts, GBP/USD is for regaining its status above the 1.3600 mark. However, there are multiple upside barriers near 1.3660 that test the bulls afterward.

Also acting as the key resistance are the 1.3700 round-figure and an ascending trend line from January 04, at 1.3715 now.

Alternatively, a daily closing below 21-day SMA of 1.3573 will recall GBP/USD sellers targeting an ascending trend line from December 22, currently around 1.3515.

It should, however, be noted that any further weakness past-1.3515 will not hesitate to probe a five-week-old support line near 1.3375.

GBP/USD daily chart
Trend: Bullish

Additional important levels

Overview
Today last price1.3583
Today Daily Change-1 pip
Today Daily Change %-0.01%
Today daily open1.3584
 
Trends
Daily SMA201.3567
Daily SMA501.3426
Daily SMA1001.3204
Daily SMA2001.2914
 
Levels
Previous Daily High1.3698
Previous Daily Low1.3572
Previous Weekly High1.371
Previous Weekly Low1.3451
Previous Monthly High1.3686
Previous Monthly Low1.3134
Daily Fibonacci 38.2%1.3621
Daily Fibonacci 61.8%1.365
Daily Pivot Point S11.3538
Daily Pivot Point S21.3492
Daily Pivot Point S31.3412
Daily Pivot Point R11.3664
Daily Pivot Point R21.3744
Daily Pivot Point R31.379

Author

Anil Panchal

Anil Panchal

FXStreet

Anil Panchal has nearly 15 years of experience in tracking financial markets. With a keen interest in macroeconomics, Anil aptly tracks global news/updates and stays well-informed about the global financial moves and their implications.


More from Anil Panchal
Share:

Editor's Picks

GBP/USD drops below 1.3450 on USD rebound

GBP/USD trades in negative territory below 1.3450 in the European trading hours on Friday. Heightened Middle East tensions and rising global oil prices provide some support for the safe-haven US Dollar (USD), weighing on the pair. The US Michigan Consumer Sentiment Index will be published later on Friday. 

EUR/USD retreats to 1.1500 after EU inflation data

EUR/USD corrects lower on Friday and trades near 1.1500 following a two-day rally that saw the pair gain more than 1%. While the risk-averse market atmosphere supports the US Dollar and weighs on the pair, the stronger-than-expected core HICP inflation reading from the Eurozone helps the Euro limit its losses.

Gold declines but stays above $4,000 as Iran risks revive USD demand

Gold comes under renewed bearish pressure following a two-day recovery and trades deep in the red below $4,100, as the US Dollar regains its traction. Escalating US-Iran tensions keep inflation risks and Fed rate hike bets in play, supporting the USD, while the technical setup seems tilted in favor of bearish traders and backs the case for further losses.

Bitcoin eyes 50-day EMA breakout, Ethereum consolidates, XRP steadies

Bitcoin, Ethereum, and Ripple trade near key technical levels on Friday as the broader cryptocurrency market pauses following last week's recovery. BTC is approaching the 50-day Exponential Moving Average while ETH continues to consolidate between two major EMAs.

Indian Rupee hits fresh two-week high against US Dollar

The Indian Rupee extends the week-long rally against the US Dollar on Friday. The USD/INR pair slides to a fresh over two-week low near 95.30 due to the overnight slump in the US Dollar amid growing doubts regarding whether the Federal Reserve is seriously committed to bringing the United States inflation down.

9-3: Is the Federal Reserve’s vote tally Warsh's new forward guidance?
The rate did not move. Neither did the statement, and that’s the more interesting fact. Set the July 29 Federal Open Market Committee (FOMC) statement beside the one issued on June 17, and the two documents are identical apart from a single verb and a paragraph at the bottom naming three dissenters.















