|

GBP/USD Price Analysis: Bears take breather above 1.1900

  • GBP/USD has turned sideways above 1.1900 ahead of US NFP and UK manufacturing data.
  • The 10-year US Treasury yields have dropped firmly to near 3.83% amid mixed responses on the US labor market.
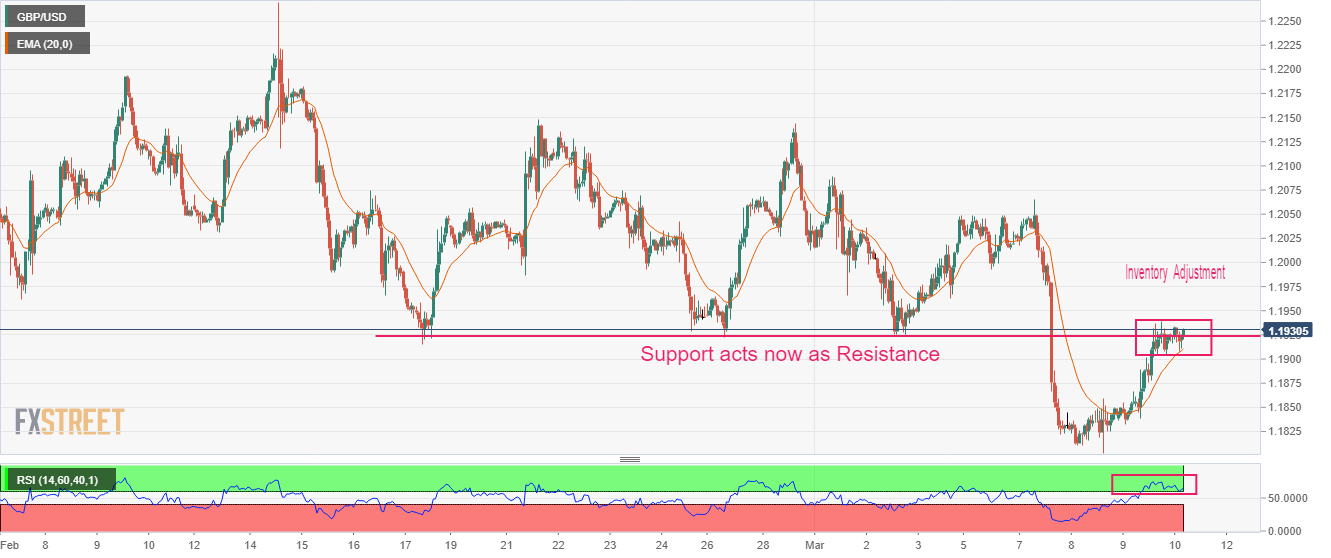
  • The Cable has met with the horizontal resistance plotted from 1.1915.

The GBP/USD pair is displaying a back-and-forth action in a narrow range of 1.1904-1.1940 continuously from the late New York session. The Cable has turned sideways as investors are awaiting the release of the United States Nonfarm Payrolls (NFP) and the United Kingdom’s manufacturing data for fresh impetus.

The US Dollar Index (DXY) is facing heat in extending its recovery above 105.35 as mixed responses from US labor market-linked indicators have confused investors about the strength of the labor market. A significant jump in Initial Jobless Claims data released on Thursday, and a four-fold planned lay-off, as reported by Reuters, indicates signs of deceleration in the employment status, which has improved demand for US Treasury bonds. The 10-year US Treasury yields have dropped firmly to near 3.83%.

Stretched recovery in the GBP/USD pair has met with the horizontal resistance plotted from February 17 low at 1.1915 on an hourly scale. The Cable is demonstrating an inventory adjustment phase, which could be a transfer of inventory from institutional investors to retail participants.

The 20-period Exponential Moving Average (EMA) at 1.1910 is providing cushion to the Pound Sterling.

Meanwhile, the Relative Strength Index (RSI) (14) has slipped to near 60.00 but has not surrendered the bullish range yet.

Should the Cable break below the round-level support of 1.1900, US Dollar bulls will drag the asset further toward March 08 high at 1.1860 followed by November 17 low at 1.17633.

On the flip side, a move above February 24 high at 1.2040 will drive the asset toward February 23 high around 1.2080. A breach of the latter will expose the asset to February 21 high around 1.2140.

GBP/USD hourly chart

GBP/USD

Overview
Today last price1.1928
Today Daily Change0.0009
Today Daily Change %0.08
Today daily open1.1919
 
Trends
Daily SMA201.2015
Daily SMA501.213
Daily SMA1001.201
Daily SMA2001.1903
 
Levels
Previous Daily High1.1939
Previous Daily Low1.1832
Previous Weekly High1.2143
Previous Weekly Low1.1922
Previous Monthly High1.2402
Previous Monthly Low1.1915
Daily Fibonacci 38.2%1.1898
Daily Fibonacci 61.8%1.1873
Daily Pivot Point S11.1854
Daily Pivot Point S21.179
Daily Pivot Point S31.1747
Daily Pivot Point R11.1961
Daily Pivot Point R21.2003
Daily Pivot Point R31.2068

Author

Sagar Dua

Sagar Dua

FXStreet

Sagar Dua is associated with the financial markets from his college days. Along with pursuing post-graduation in Commerce in 2014, he started his markets training with chart analysis.

More from Sagar Dua
Share:

Editor's Picks

GBP/USD surges to multi-day peaks past 1.3250

GBP/USD leaves behind Friday’s small pullback and advances past 1.3250 level, or five-day highs, on Monday. Cable’s upside follows extra losses in the Greenback, while traders continue to assess the geopolitical front and upcoming key events.

EUR/USD pops to daily highs near 1.1430

EUR/USD starts the week on a positive note, climbing to as high as the 1.1430 zone, or daily tops, on Monday. The pair’s recovery comes in response to the broad-based US Dollar weakness, while investors continue to monitor developments from the Middle East ahead of the beginning of the ECB's annual forum.

Gold struggles to attract investors

Gold remains under marked selling pressure, holding on just above the key $4,000 mark per troy ounce at the beginning of the week. The precious metal reverses two daily advances in a row as renewed effervescence in the Middle East revive inflation concerns and bolster Fed rate hike expectations.

Bitcoin four-year cycle: BTC risks 75% drawdown with four months of bear market still ahead

Bitcoin price continues to trend downward below the $60,000 support zone after losing over 50% of its value since the $126,199 high in October. Bitcoin’s four-year cycle, measured from cycle tops to bottoms, suggests that four months of a bear market are still ahead.

Just like Fed, is BoJ’s independence under threat?

When talking about central bank independence, most of the focus has been on Donald Trump’s pressure on the Federal Reserve. But a similar story, a quieter one for now, seems to be happening on the other side of the Pacific: Japan’s government may be testing the Bank of Japan’s independence.

Kevin Warsh isn't expected to say much in Sintra: That's exactly why markets will listen

Financial markets could find an important catalyst in the enchanting, fairytale-like landscape of Sintra this week. The ECB Forum will, as it does every year, gather the crème de la crème of central banks. The new boss at the Fed, who has clearly said that the Fed should stop explaining everything, will need to talk – and traders should listen.